Australia's persistence the difference
In an extremely slow-scoring series, Australia's all-round strength and fighting ability proved crucial to the series outcome
Madhusudhan Ramakrishnan
Apr 29, 2012, 6:05 AM
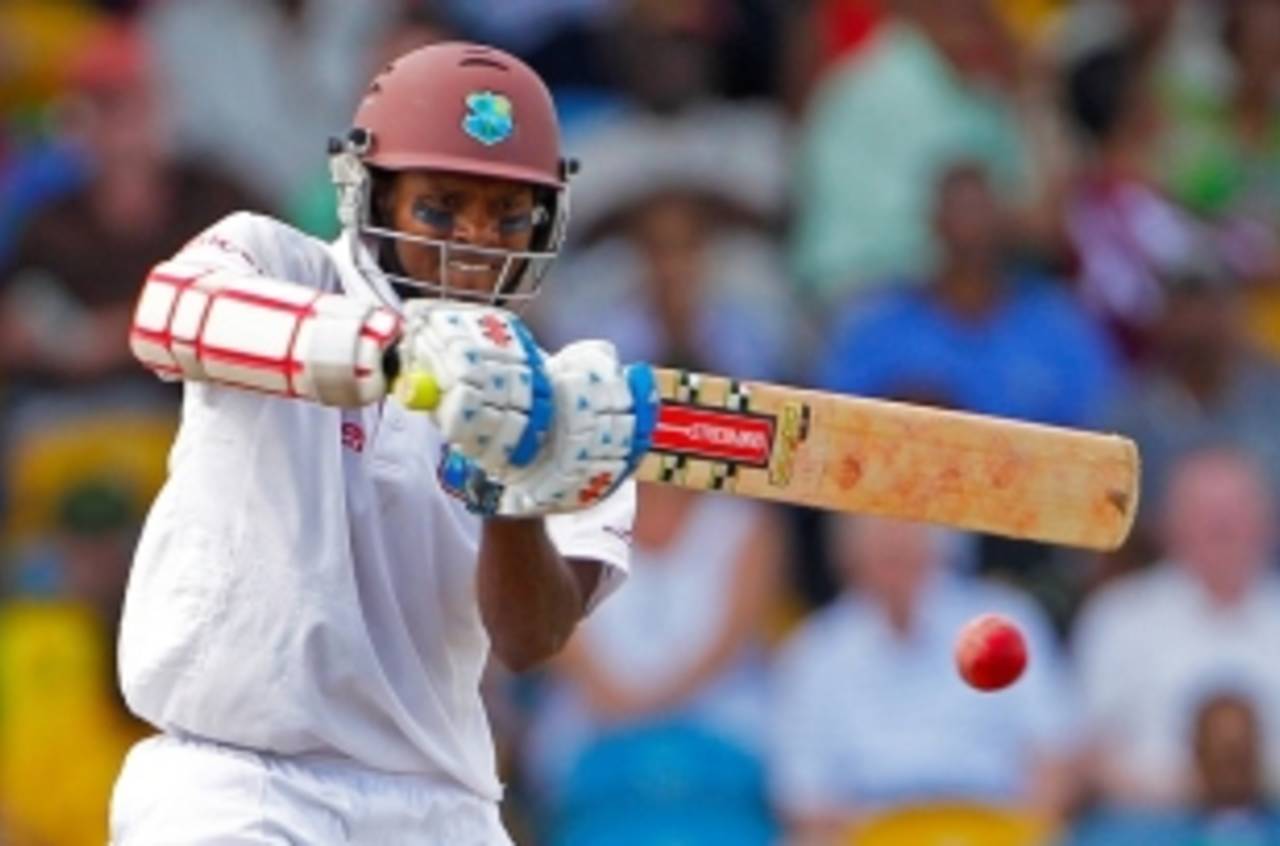
Shivarine Chanderpaul averaged 50 more than Michael Hussey, the second-highest run-getter in the series • Associated Press
Given the extent to which Australia have dominated West Indies in recent years, the three Tests turned out to be more closely fought than expected. West Indies tried hard but were never quite able to sustain their intensity long enough in any of the matches. Both teams struggled to raise the tempo on pitches that provided assistance to spinners and it was only Michael Clarke's enterprising declaration that provided a chance of a result in the first Test in Barbados. West Indies, who had shown some form in the ODI series, were unable to match up to it in the Tests and ended up losing their sixth consecutive series against Australia. In Barbados, which was once their stronghold (no defeat for 59 years), they have now failed to win a single Test against top-Test teams for almost seven years. Meanwhile, Australia, who were not quite at their dominant best, won their third series since the Ashes defeat in early 2011. In the same period, they have compiled an excellent 9-2 win-loss record including series wins against Sri Lanka and India.
Australia were the team who ended West Indies' extraordinary run of 22 straight years without a home series defeat when they won 2-1 in 1995. Since then, they have completely turned the tables on West Indies and won seven out of eight series. The only series West Indies avoided defeat in was the 1999 home series when Brian Lara's batting exploits ensured a 2-2 draw. Since 2000, Australia have won 17 Tests against West Indies, the most they have against any opposition team in the same period. While their overall numbers against West Indies (win-loss ratio 1.65) are very good, it is their recent record that tilts the balance in their favour. In the period between 1970-1999, West Indies had a 25-20 record but that has fallen away sharply to 1-17 since 2000 with their solitary win coming in Antigua in 2003 when they chased down a record 418.
| Period | Wins | Losses | Draws | W/L ratio | |
| Overall | 1930-present | 54 | 32 | 24 | 1.67 |
| In Australia | 1970-1999 | 12 | 14 | 6 | 0.85 |
| In Australia | 2000-present | 10 | 0 | 1 | - |
| In West Indies | 1970-1999 | 8 | 11 | 9 | 0.72 |
| In West Indies | 2000-present | 7 | 1 | 2 | 7.00 |
The teams have played six series since the start of 2000 and Australia have emerged victorious in all of them. Between 2000 and 2005, Australia boasted a top-class team and West Indies hardly stood a chance. In the drubbing in Australia in 2000 when they lost 5-0, Australia averaged 40.53 with the bat while the corresponding number for West Indies was just 20.05. In the 2003 series in West Indies, not only was Australia's average high (56.66), their run-rate through the series was almost close to four runs per over. In contrast, West Indies were way behind and the average difference (difference between Australia's batting average and West Indies' batting average) was 22.89. The average and run-rate difference (difference in run-rates of Australia and West Indies) were even higher in the 2005 series in Australia. However, since the retirement of their top players, Australia were not quite able to dominate West Indies similarly. Although they won 2-0 in both 2008 and 2009, the average difference and run-rate difference were greatly reduced. In the 2012 series, Australia's batting was highly inconsistent and they averaged under 40 against West Indies for the first time since 2000. West Indies, however, did even poorer averaging just 27.82. Another stand-out aspect of the series is the run-rates of both teams. For the first time, both teams scored at lower than three runs per over and the series was the slowest-scoring one between the teams since 1990.
| Series (Host) | Matches | Series result | Australia (bat avg) | West Indies (bat avg) | Avg diff | Australia (RR) | West Indies (RR) | RR diff |
| 2000-01 (Australia) | 5 | 5-0 (Australia) | 40.53 | 20.05 | 20.48 | 3.28 | 2.70 | 0.58 |
| 2003 (West Indies) | 4 | 3-1 (Australia) | 56.66 | 33.77 | 22.89 | 3.94 | 3.23 | 0.71 |
| 2005-06 (Australia) | 3 | 3-0 (Australia) | 50.33 | 23.85 | 26.48 | 3.70 | 2.85 | 0.85 |
| 2008 (West Indies) | 3 | 2-0 (Australia) | 41.89 | 31.34 | 10.55 | 3.38 | 3.20 | 0.18 |
| 2009-10 (Australia) | 3 | 2-0 (Australia) | 45.02 | 30.30 | 14.72 | 3.43 | 3.53 | -0.10 |
| 2012 (West Indies) | 3 | 2-0 (Australia) | 30.66 | 27.82 | 2.45 | 2.81 | 2.73 | 0.08 |
In a series where batsmen struggled to counter the bowling on slow pitches, batsmen from both sides were unable to capitalise on starts. Except for Shivnarine Chanderpaul, who had scores of 103, 94, 68 and 69 in the three Tests, no other batsman was able to display any consistency. The top-three batsmen for Australia averaged under 30 and managed four half-centuries but could not carry on to post a single century. West Indies' top three were very ordinary with Kraigg Brathwaite in particular having a woeful run (three consecutive ducks). Brathwaite and Adrian Barath were often in trouble at the start, especially against Ben Hilfenhaus who dismissed them three times each.The openers managed just two fifties and had a strike rate below 40. West Indies' middle-order (4-7) batsmen did much better than their Australia counterparts primarily because of the remarkable efforts of Chanderpaul, who became the tenth batsman to reach the 10000-run mark. West Indies' middle-order batsmen finished with a better average and a higher number of fifty-plus scores. Australia's lower-order batsmen averaged higher than those of West Indies, and demonstrated grit and patience in all three matches to frustrate the hosts' bowlers.
| Batting position | Australia (Runs/avg) | Australia (100/50, SR) | West Indies (Runs/avg) | West Indies (100/50, SR) |
| 1-3 | 516/28.66 | 0/4, 43.54 | 315/18.52 | 0/2, 39.22 |
| 4-7 | 751/32.65 | 1/3, 43.56 | 730/38.42 | 1/5, 40.78 |
| 8-11 | 293/22.53 | 0/1, 45.56 | 294/19.60 | 0/1, 55.05 |
The series turned out to be one of the lowest scoring ones in the West Indies in recent years. It was no surprise then, that the teams found it extremely hard to stitch together useful partnerships consistently. Although Australia's opening pair averaged under 30 (two fifty stands), West Indies did not even manage to aggregate fifty runs in the six innings. Their partnership average of 7.83 is the second-lowest for a West Indies opening pair (minimum six partnerships in a series) since 1990. West Indies did slightly better than Australia for the second wicket, sharing a century and fifty partnership while Australia managed only two fifty stands. Australia did better for the third wicket but were well behind West Indies on the fourth and fifth-wicket partnership stats. Chanderpaul, who gave West Indies some hope in all matches, was crucial to their middle-order success. Matthew Wade, Australia's only century scorer, featured in a couple of vital stands in the lower order and this was a major reason why their lower-order partnership average was better than the hosts'.
| Partnership wicket | Australia (Runs/avg) | Australia (100/50 stands) | West Indies (Runs/avg) | West Indies (100/50 stands) |
| 1 | 178/29.66 | 0/2 | 47/7.83 | 0/0 |
| 2 | 193/32.16 | 0/2 | 227/37.83 | 1/1 |
| 3 | 196/32.66 | 0/1 | 106/21.20 | 0/0 |
| 4 | 267/44.50 | 0/2 | 270/54.00 | 1/2 |
| 5 | 122/20.33 | 0/1 | 254/50.80 | 1/1 |
| 6 | 183/30.50 | 0/1 | 54/10.80 | 0/0 |
| 7 | 135/22.50 | 0/1 | 133/26.60 | 0/1 |
| 8-11 | 382/31.83 | 1/2 | 328/23.42 | 0/1 |
For years, spinners had found it almost impossible to have an impact in West Indies as most venues were extremely conducive to pace bowling. However, in recent years, that has changed drastically. When Pakistan toured West Indies after the World Cup last year, Saeed Ajmal performed superbly. In this series as well, not only did Nathan Lyon and Shane Shillingford trouble the batsmen, even Clarke was able to extract sufficient turn and bounce in the final Test in Dominica. Clarke picked up only his second five-wicket haul in Tests to give Australia a 75-run win in a match where 26 wickets fell to spinners (average 21.73). In contrast, pace bowlers managed only 12 wickets at an average of 41.00. Barbados, however, continued to favour pace, as fast bowlers picked up 25 wickets at 29.00 while spinners managed only eight wickets while averaging 52.75. In Trinidad, where Kemar Roach picked up a ten-wicket match haul, pace bowlers were slightly more successful than spinners. Overall, in the series, the fast bowlers picked up more wickets (54) than spinners (47) but had a slightly higher average (30.16) than the slow bowlers (28.21).
| Pace (wickets/avg) | Pace (5WI/10WM) | Spin (wickets/avg) | Spin (5WI/10WM) | |
| Barbados | 25/29.00 | 0/0 | 8/52.75 | 0/0 |
| Trinidad | 17/24.23 | 2/1 | 13/26.07 | 1/0 |
| Dominica | 12/41.00 | 0/0 | 26/21.73 | 2/1 |
| Overall | 54/30.16 | 2/1 | 47/28.21 | 3/1 |
Madhusudhan Ramakrishnan is a sub-editor (stats) at ESPNcricinfo