ODI batting: location summary, country details and key matches
An analysis of ODI batting performances by opposition, host country and major tournaments
Sachin Tendulkar has displayed outstanding consistency across his long career • AFP
Normally I do analysis-centric articles which take on and expound a theme. Once in a while I do different types of articles in which I go deep in one area of the game and provide data tables around it. This is one such article. However I can assure the readers that once the reader understands what is being covered, he will download the tables and keep the same for permanent reference. This has been a tough exercise on presentation and I must thank Milind for his invaluable suggestions.
In order to avoid the usual questions and comments which relate to specific players, let me emphasize how these series of articles would be structured. I would cover the top/selected 10-12 players in a graph to visually present the variations. Then I would present data tables, in the body of the articles, which would normally cover the top 25 players or so. However the most important of the tables are the ones which have been uploaded and are available for downloading for permanent storage and perusal. Normally these cover the complete collection of players, say 150, who meet the cut-off criteria. So, before coming out with comments that "Miandad or Nick Knight or Amarnath are not mentioned", please download the tables and check. Superficial reading of the articles is not enough.
Over the next month or or two, I will be doing the following four tables. These may all not follow in sequence. I may intersperse other pending analysis in between.
1. ODI Batting analysis - summary by location and details by country played against and key tournament matches.
2. ODI Bowling analysis - summary by location and details by country played against and key tournament matches.
3. Test Batting analysis - summary by location and details by country played against.
4. Test Bowling analysis - summary by location and details by country played against.
The vs Country grouping is as explained below. I have 10 countries/groups: Australia, England, India, New Zealand, Pakistan, South Africa, Sri Lanka, West Indies, Bangladesh & Zimbabwe combined and finally "all other teams". A fair grouping and nothing of relevance would be left out. And the analysis is very extensive in that it is by country played against: at home, away, in neutral locations and across career.
I have defined the key tournament matches by the following criteria. I have deliberately excluded the tri-series Finals from this group. At last count there were well over 100 such tournaments and inclusion of these tournaments would dilute the whole concept. Readers might differ. However it should be noted that inclusion of the Sharjah tournaments would also mean inclusion of all CB/VB Series and all inconsequential tri-series ever played. For that matter I have set the criteria as tournaments with 6 teams and above. World Cup Super-Sixes and Super-Eights rank with the Quarter finals.
10 World Cup Finals
20 World Cup Semi-finals
8 World Cup Quarter finals
45 World Cup Super-Sixes and Super-Eights
7 ICC/Champions' Trophy Finals
12 ICC/Champions' Trophy Semi finals
3 Finals of the following three 6+ team tournaments
- Benson & Hedges World Championship of Cricket, 1984/85 (7 teams)
- MRF World Series (Nehru Cup), 1989/90 (6 teams)
- Australasia Cup, 1989/90 (6 teams)
First the graphs. I would only offer limited comments since I expect the readers to come out with their own comments. I might miss some obvious comment. Should not really matter. The ordering is different for different modes of presentation since we can get different insights. In general, the graphs are ordered by the concerned RpI values and the tables are ordered by the appropriate run values. For ODIs I am a great fan of RpI (Runs per innings) than Batting average. Granted this measure might be slightly unfair to those middle order players who end unbeaten in over 20% of the innings and have a fat Batting average. However I think that is small price to pay for having a measure which measures the real contributions. So, no Batting average in this article.
Batsmen analysis - Summary by location
 Run distribution by host country
© Anantha Narayanan
This graph contains the top 10 run-scorers and five other outstanding ODI batsmen. The Green rectangles indicate RpI values over 35.0 and Red rectangles indicate RpI values below 35.0. The size of the rectangle gives an indication of the RpI value. The numbers within the rectangles indicate the number of runs scored in that classification. Tendulkar has comfortable 40+ RpI values at home and in neutral venues and falls marginally below 35.0 in away matches. Ponting, Kallis and Ganguly average above 35.0 in all three areas. Jayasuriya falls below 35.0 in all areas. Haynes is the outstanding Home performer, with a mind-blowing RpI value of 52.51. Tendulkar's RpI value at neutral venues is the highest at 43.73. Richards has a magnificent away RpI value of 47.82. It is amazing that Richards has only played 26 matches at home and not even crossed 1000 runs.
Batsmen analysis - All matches - by opposing country
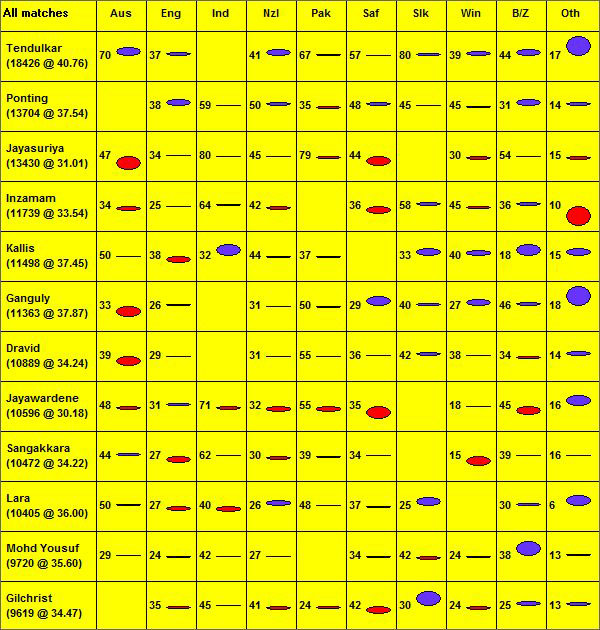 Run distribution by opposition team
© Anantha Narayanan
This graph requires some explanation. These are ordered by the RpI values. The player's performance against the 10 team groups are plotted. Blue ovals indicate RpI values of over 35.0 and Red ovals indicate RpI values below 35.0. The number of innings is displayed under each country. Amla crosses 35.0 against all countries. However the number of matches is quite low. Now look at Tendulkar's graph. He has crossed 35.0 against all countries. That is some level of consistency especially considering that he has played over 30 matches against all countries, barring the non-Test teams. Kohli also has similar figures, barring against the non-Test countries.
A vertical perusal of the table indicates that Australia is the toughest country to bat against and Sri Lanka, relatively the friendliest one.
Batsmen analysis - Home matches - by opposing country
 Run distribution in home ODIs by opposition team
© Anantha Narayanan
Haynes leads the table, with a RpI value of 52.51. Tendulkar's home figures are all above-par, barring, surprisingly, against Bangladesh/Zimbabwe. Real surprise is that no batsman has a 100% record of 35+ average against all countries. Possibly Tendulkar has the best overall home record.
Batsmen analysis - Away matches - by opposing country
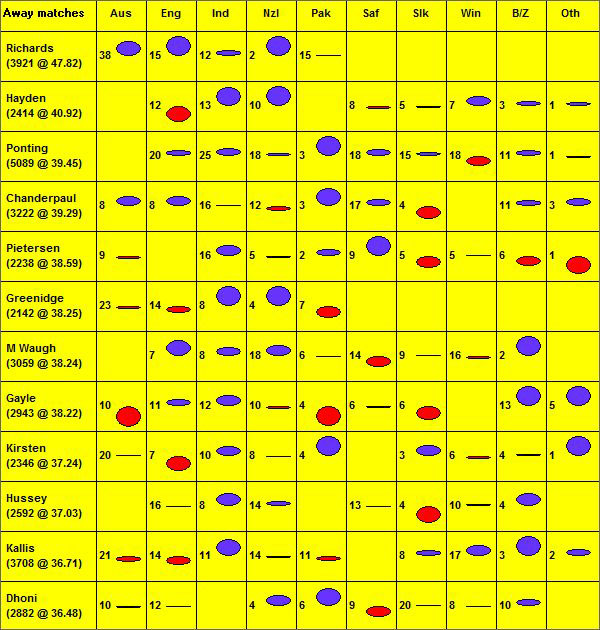 Run distribution in away ODIs by opposition team
© Anantha Narayanan
As expected, the away RpI values graph has a smattering of red ovals scattered across. Richards has crossed 35 everywhere, but with fewer matches. Chanderpaul's graph looks very good. It can be seen that an almost completely different set of batsmen are featured here. It is not easy to average RpI of 40+ in away matches across a career. Only Richards and Hayden have achieved that. Richards' 47.83 is well above his career RpI. Tendulkar has gone below 35.0 only because of one blot in his career: an RpI of 25 in the away matches against South Africa.
Batsmen analysis - Neutral matches - by opposing country
 Run distribution in neutral ODIs by opposition team
© Anantha Narayanan
In neutral locations, Tendulkar is king, with an outstanding RpI value of 43.73. Only against South Africa does he slip to 34.9. Otherwise all RpI values are above 35. No one else has achieved anywhere near this level of consistency.
Now for the tables. Most of these are self-explanatory.
| Career | KeyMats | Home | Neutral | Away | |||||||||||
|---|---|---|---|---|---|---|---|---|---|---|---|---|---|---|---|
| Batsman | Inns | Runs | RpI | Inns | Runs | RpI | Inns | Runs | RpI | Inns | Runs | RpI | Inns | Runs | RpI |
| Tendulkar | 452 | 18426 | 40.76 | 18 | 656 | 36.44 | 160 | 6976 | 43.60 | 146 | 6385 | 43.73 | 146 | 5065 | 34.69 |
| Ponting | 365 | 13704 | 37.54 | 26 | 1163 | 44.73 | 150 | 5406 | 36.04 | 86 | 3208 | 37.30 | 129 | 5089 | 39.45 |
| Jayasuriya | 433 | 13430 | 31.01 | 20 | 656 | 32.80 | 124 | 3880 | 31.29 | 162 | 5463 | 33.72 | 147 | 4087 | 27.80 |
| Inzamam | 350 | 11739 | 33.54 | 10 | 256 | 25.60 | 64 | 2674 | 41.78 | 159 | 5133 | 32.28 | 127 | 3932 | 30.96 |
| Kallis | 307 | 11498 | 37.45 | 16 | 794 | 49.62 | 131 | 5102 | 38.95 | 75 | 2689 | 35.85 | 101 | 3708 | 36.71 |
| Ganguly | 300 | 11363 | 37.87 | 11 | 684 | 62.18 | 75 | 3110 | 41.47 | 127 | 4785 | 37.68 | 98 | 3468 | 35.39 |
| Dravid | 318 | 10889 | 34.24 | 12 | 392 | 32.67 | 91 | 3406 | 37.43 | 114 | 3439 | 30.17 | 113 | 4044 | 35.79 |
| Jayawardene | 351 | 10596 | 30.18 | 16 | 610 | 38.12 | 107 | 3229 | 30.18 | 113 | 3810 | 33.72 | 131 | 3557 | 27.15 |
| Sangakkara | 306 | 10472 | 34.22 | 17 | 557 | 32.76 | 96 | 3025 | 31.51 | 87 | 3021 | 34.72 | 123 | 4426 | 35.98 |
| Lara | 289 | 10405 | 36.00 | 14 | 471 | 33.64 | 85 | 3225 | 37.94 | 111 | 3969 | 35.76 | 93 | 3212 | 34.54 |
| Mohd Yousuf | 273 | 9720 | 35.60 | 4 | 98 | 24.50 | 66 | 2768 | 41.94 | 105 | 3497 | 33.30 | 102 | 3456 | 33.88 |
| Gilchrist | 279 | 9619 | 34.47 | 22 | 764 | 34.73 | 110 | 3960 | 36.00 | 62 | 2017 | 32.53 | 107 | 3642 | 34.04 |
| Azharuddin | 308 | 9378 | 30.44 | 8 | 209 | 26.12 | 102 | 3163 | 31.01 | 121 | 3411 | 28.19 | 85 | 2804 | 32.99 |
| de Silva | 296 | 9284 | 31.36 | 12 | 529 | 44.08 | 66 | 2407 | 36.47 | 133 | 3950 | 29.70 | 97 | 2927 | 30.18 |
| Saeed Anwar | 244 | 8824 | 36.16 | 9 | 544 | 60.44 | 40 | 1597 | 39.92 | 135 | 5353 | 39.65 | 69 | 1873 | 27.14 |
| Chanderpaul | 251 | 8778 | 34.97 | 15 | 596 | 39.73 | 84 | 2926 | 34.83 | 85 | 2632 | 30.96 | 82 | 3222 | 39.29 |
| Haynes | 237 | 8648 | 36.48 | 5 | 234 | 46.80 | 49 | 2573 | 52.51 | 87 | 3042 | 34.97 | 101 | 3033 | 30.03 |
| Atapattu | 259 | 8529 | 32.93 | 8 | 247 | 30.88 | 71 | 2559 | 36.04 | 96 | 2915 | 30.36 | 92 | 3055 | 33.21 |
| M Waugh | 236 | 8500 | 36.01 | 8 | 351 | 43.88 | 113 | 3827 | 33.87 | 43 | 1614 | 37.53 | 80 | 3059 | 38.24 |
| Gibbs | 240 | 8094 | 33.72 | 12 | 668 | 55.67 | 102 | 3556 | 34.86 | 58 | 1974 | 34.03 | 80 | 2564 | 32.05 |
| Sehwag | 239 | 8090 | 33.84 | 11 | 335 | 30.45 | 82 | 2905 | 35.43 | 71 | 2270 | 31.97 | 86 | 2915 | 33.90 |
| Gayle | 223 | 8087 | 36.26 | 11 | 370 | 33.64 | 90 | 3072 | 34.13 | 56 | 2073 | 37.02 | 77 | 2943 | 38.22 |
| Yuvraj Singh | 252 | 8051 | 31.94 | 10 | 302 | 30.20 | 83 | 2927 | 35.27 | 68 | 1747 | 25.69 | 101 | 3377 | 33.44 |
| J Miandad | 218 | 7381 | 33.85 | 9 | 307 | 34.11 | 60 | 1976 | 32.93 | 82 | 2832 | 34.54 | 76 | 2573 | 33.86 |
| Bevan | 196 | 6912 | 35.26 | 10 | 325 | 32.50 | 80 | 2849 | 35.61 | 45 | 1577 | 35.04 | 71 | 2488 | 35.04 |
| Younis Khan | 232 | 6814 | 29.37 | 2 | 28 | 14.00 | 52 | 1796 | 34.54 | 93 | 2295 | 24.68 | 87 | 2727 | 31.34 |
| Kirsten | 185 | 6798 | 36.74 | 6 | 155 | 25.83 | 63 | 2068 | 32.83 | 59 | 2384 | 40.41 | 63 | 2346 | 37.24 |
| Flower | 208 | 6786 | 32.62 | 6 | 142 | 23.67 | 57 | 1887 | 33.11 | 76 | 2544 | 33.47 | 75 | 2354 | 31.39 |
| Dhoni | 184 | 6773 | 36.80 | 3 | 123 | 41.00 | 67 | 2659 | 39.69 | 38 | 1232 | 32.42 | 79 | 2882 | 36.48 |
| Richards | 167 | 6721 | 40.24 | 7 | 324 | 46.29 | 26 | 805 | 30.96 | 59 | 1995 | 33.81 | 82 | 3921 | 47.82 |
Since I have already talked about the Home/Away/Neutral performances in the graph section, I would only talk about the key tournament matches here. The bar for selection for the key tournament matches has been set quite high, and that is the way it should be. It can be safely concluded that these runs have all been scored in real tough situations. Ponting is the runaway leader in this classification, having scored 1163 runs at a very high RpI value of 44.73. This is a very impressive record and should not be swept under the carpet. Imagine, Ponting has scored nearly 10% of his career runs in tough tournament situations. No wonder that Australia won five major World tournaments during the past 20 years. Kallis follows next with an impressive 794 runs at 49.62. Although this has not resulted in many tournament successes. Gilchrist follows next, with 764 runs, albeit at a low RpI value of 34.73. Ganguly is next with an impressive tally of 684 runs at a more impressive 62.18. In fifth place is Gibbs, with 668 runs at a huge 55.67.
| Batsman | Inns | Runs | RpI | vs AUS | vs ENG | vs IND | vs NZL | vs PAK | vs SAF | vs SLK | vs WIN | vs B/Z | vs OTH |
|---|---|---|---|---|---|---|---|---|---|---|---|---|---|
| All matches | RpI (I) | RpI (I) | RpI (I) | RpI (I) | RpI (I) | RpI (I) | RpI (I) | RpI (I) | RpI (I) | RpI (I) | |||
| Tendulkar | 452 | 18426 | 40.76 | 44.0 (70) | 39.3 (37) | 42.7 (41) | 37.7 (67) | 35.1 (57) | 38.9 (80) | 40.3 (39) | 42.6 (44) | 62.2 (17) | |
| Ponting | 365 | 13704 | 37.54 | 42.1 (38) | 36.7 (59) | 39.4 (50) | 31.6 (35) | 39.1 (48) | 36.6 (45) | 32.8 (45) | 42.3 (31) | 39.4 (14) | |
| Jayasuriya | 433 | 13430 | 31.01 | 20.6 (47) | 35.1 (34) | 34.1 (85) | 33.8 (45) | 31.9 (79) | 24.2 (44) | 30.7 (30) | 34.9 (54) | 30.8 (15) | |
| Inzamam | 350 | 11739 | 33.54 | 29.1 (34) | 33.4 (25) | 37.5 (64) | 30.5 (42) | 26.9 (36) | 39.1 (58) | 32.0 (45) | 39.2 (36) | 14.4 (10) | |
| Kallis | 307 | 11498 | 37.45 | 33.2 (50) | 27.7 (38) | 47.3 (32) | 33.0 (44) | 32.9 (37) | 43.3 (33) | 41.6 (40) | 47.8 (18) | 43.1 (15) | |
| Ganguly | 300 | 11363 | 37.87 | 23.5 (33) | 37.5 (26) | 34.8 (31) | 33.0 (50) | 45.3 (29) | 38.4 (40) | 42.3 (27) | 39.7 (46) | 59.3 (18) | |
| Dravid | 318 | 10889 | 34.24 | 25.0 (39) | 34.9 (29) | 33.3 (31) | 34.5 (55) | 36.4 (36) | 39.6 (42) | 35.5 (38) | 31.8 (34) | 40.8 (14) | |
| Jayawardene | 351 | 10596 | 30.18 | 30.8 (48) | 38.7 (31) | 31.0 (71) | 28.9 (32) | 28.4 (55) | 21.1 (35) | 34.3 (18) | 25.2 (45) | 46.4 (16) | |
| Sangakkara | 306 | 10472 | 34.22 | 38.8 (44) | 27.6 (27) | 36.0 (62) | 30.6 (30) | 32.9 (39) | 36.5 (34) | 24.9 (15) | 36.1 (39) | 35.6 (16) | |
| Lara | 289 | 10405 | 36 | 37.2 (50) | 29.4 (27) | 28.6 (40) | 41.1 (26) | 36.9 (48) | 32.9 (37) | 44.9 (25) | 38.4 (30) | 46.5 ( 6) | |
| Mohd Yousuf | 273 | 9720 | 35.6 | 35.0 (29) | 32.2 (24) | 34.0 (42) | 33.6 (27) | 32.8 (34) | 30.6 (42) | 32.4 (24) | 50.7 (38) | 37.8 (13) | |
| Gilchrist | 279 | 9619 | 34.47 | 31.1 (35) | 36.0 (45) | 30.4 (41) | 31.7 (24) | 26.8 (42) | 50.4 (30) | 30.6 (24) | 40.6 (25) | 39.5 (13) | |
| Azharuddin | 308 | 9378 | 30.44 | 24.1 (41) | 39.6 (23) | 28.7 (39) | 28.1 (59) | 33.6 (33) | 38.2 (48) | 23.8 (42) | 32.0 (21) | 45.0 ( 2) | |
| de Silva | 296 | 9284 | 31.36 | 40.3 (36) | 30.5 (15) | 32.5 (55) | 23.0 (36) | 31.8 (73) | 22.5 (27) | 17.8 (27) | 49.1 (22) | 54.8 ( 5) | |
| Saeed Anwar | 244 | 8824 | 36.16 | 22.8 (30) | 44.4 (11) | 41.7 (48) | 39.4 (32) | 16.6 (24) | 42.2 (52) | 33.4 (16) | 47.0 (21) | 27.3 (10) | |
| Chanderpaul | 251 | 8778 | 34.97 | 35.3 (25) | 39.5 (23) | 32.2 (41) | 26.8 (26) | 32.9 (33) | 40.0 (39) | 34.0 (20) | 35.0 (32) | 44.1 (12) | |
| Haynes | 237 | 8648 | 36.48 | 35.3 (64) | 33.9 (35) | 37.7 (36) | 48.3 (12) | 36.8 (65) | 28.2 ( 8) | 34.5 (14) | 55.0 ( 3) | ||
| Atapattu | 259 | 8529 | 32.93 | 26.4 (27) | 27.4 (19) | 30.2 (52) | 31.3 (29) | 37.6 (47) | 34.2 (34) | 26.0 (12) | 39.9 (34) | 43.8 ( 5) | |
| M Waugh | 236 | 8500 | 36.01 | 41.7 (20) | 37.5 (26) | 34.9 (39) | 24.9 (27) | 27.1 (41) | 39.4 (23) | 38.0 (45) | 56.7 (13) | 98.5 ( 2) | |
| Gibbs | 240 | 8094 | 33.72 | 30.1 (44) | 28.9 (22) | 39.4 (27) | 35.9 (29) | 27.0 (22) | 23.0 (27) | 37.0 (29) | 46.0 (27) | 38.3 (13) | |
| Sehwag | 239 | 8090 | 33.84 | 21.7 (29) | 37.3 (27) | 50.3 (23) | 35.7 (29) | 27.6 (18) | 32.3 (48) | 31.0 (27) | 38.6 (19) | 33.8 (19) | |
| Gayle | 223 | 8087 | 36.26 | 28.3 (28) | 39.4 (24) | 36.8 (32) | 33.3 (19) | 31.1 (27) | 32.4 (27) | 24.7 (15) | 44.7 (38) | 58.2 (13) | |
| Yuvraj Singh | 252 | 8051 | 31.94 | 29.2 (33) | 42.4 (28) | 18.7 (27) | 37.9 (33) | 29.0 (21) | 28.4 (49) | 39.1 (21) | 34.0 (25) | 31.5 (15) | |
| Fleming | 269 | 8037 | 29.87 | 27.0 (46) | 32.2 (19) | 28.9 (38) | 32.1 (34) | 34.6 (37) | 18.1 (33) | 34.0 (27) | 35.5 (26) | 30.6 ( 9) | |
| S Waugh | 288 | 7569 | 26.28 | 23.8 (28) | 24.8 (45) | 21.3 (51) | 25.1 (40) | 35.9 (44) | 21.6 (20) | 23.2 (48) | 43.6 (10) | 65.5 ( 2) | |
| Ranatunga | 255 | 7456 | 29.23 | 26.9 (31) | 26.5 (17) | 28.5 (51) | 25.4 (33) | 29.5 (63) | 27.6 (16) | 34.4 (22) | 35.2 (19) | 50.0 ( 3) | |
| J Miandad | 218 | 7381 | 33.85 | 30.9 (33) | 36.7 (27) | 34.6 (34) | 35.1 (20) | 48.3 ( 3) | 36.8 (31) | 30.2 (64) | 46.3 ( 6) |
This table is ordered by career runs scored. The top 30 are shown. A smattering of RpI values above 45 are there. The ones where enough runs have been scored are Tendulkar vs Australia (44.0 but 70 innings), Gooch vs Australia (45.0), Richards vs England (47.1), Jones vs England (47.8), Kirsten vs India (53.0), Hayden vs India (51.8), Salman Butt vs India (47.2), Shoaib Malik vs India (47.1), Greenidge vs India (51.3), Sehwag vs New Zealand (50.3), Jones vs New Zealand (48.2), Kirsten vs Pakistan (43.9), Ganguly vs South Africa (45.3), Gilchrist vs Sri Lanka (50.4), Dhoni vs Sri Lanka (46.5), Kallis vs West Indies (42.3). Note the absence of high averages against Pakistan, West Indies and South Africa, strong bowling sides.
| Batsman | Inns | Runs | RpI | vs AUS | vs ENG | vs IND | vs NZL | vs PAK | vs SAF | vs SLK | vs WIN | vs B/Z | vs OTH |
|---|---|---|---|---|---|---|---|---|---|---|---|---|---|
| Home matches | RpI (I) | RpI (I) | RpI (I) | RpI (I) | RpI (I) | RpI (I) | RpI (I) | RpI (I) | RpI (I) | RpI (I) | |||
| Tendulkar | 160 | 6976 | 43.6 | 52.0 (30) | 39.4 (16) | 51.3 (16) | 36.0 (15) | 45.2 (22) | 39.9 (27) | 39.8 (17) | 30.3 (12) | 62.0 ( 5) | |
| Ponting | 150 | 5406 | 36.04 | 39.1 (14) | 28.3 (18) | 46.2 (19) | 24.4 (20) | 38.6 (22) | 31.8 (25) | 40.7 (19) | 40.7 (10) | 52.3 ( 3) | |
| Kallis | 131 | 5102 | 38.95 | 36.8 (26) | 28.5 (19) | 46.5 (11) | 30.1 (15) | 40.5 (11) | 42.3 (17) | 44.4 (18) | 46.1 (10) | 54.5 ( 4) | |
| Jones | 104 | 4069 | 39.12 | 56.1 (14) | 37.8 (10) | 48.7 (15) | 42.8 (17) | 39.8 ( 6) | 57.1 (10) | 18.8 (31) | 54.0 ( 1) | ||
| Border | 163 | 4068 | 24.96 | 23.0 (24) | 33.1 (18) | 20.1 (31) | 25.4 (23) | 16.0 ( 7) | 38.4 (11) | 24.1 (48) | 22.0 ( 1) | ||
| Gilchrist | 110 | 3960 | 36 | 28.1 (19) | 30.2 (16) | 31.6 (13) | 26.8 (12) | 27.9 (16) | 58.6 (17) | 28.6 ( 7) | 55.3 ( 7) | 60.0 ( 3) | |
| Jayasuriya | 124 | 3880 | 31.29 | 16.8 (14) | 23.3 ( 9) | 40.5 (39) | 29.0 ( 9) | 29.0 (16) | 18.1 (11) | 31.4 ( 7) | 38.1 (16) | 33.7 ( 3) | |
| M Waugh | 113 | 3827 | 33.87 | 36.5 (13) | 28.2 ( 6) | 21.9 (17) | 19.0 (15) | 32.5 (19) | 42.5 (12) | 45.3 (26) | 44.4 ( 5) | ||
| Gibbs | 102 | 3556 | 34.86 | 29.8 (25) | 35.2 (12) | 35.3 ( 7) | 66.8 ( 6) | 17.7 ( 7) | 31.9 (12) | 29.2 (15) | 49.8 (11) | 35.3 ( 7) | |
| Astle | 84 | 3448 | 41.05 | 34.9 (16) | 45.4 (10) | 24.6 ( 5) | 31.0 ( 9) | 42.7 ( 6) | 32.2 (14) | 50.8 (13) | 60.5 (11) | ||
| Dravid | 91 | 3406 | 37.43 | 28.3 (16) | 37.2 ( 6) | 38.4 ( 9) | 41.7 (11) | 31.4 (14) | 52.5 (11) | 50.9 (11) | 24.2 (11) | 41.0 ( 2) | |
| Smith | 86 | 3383 | 39.34 | 41.6 (17) | 47.2 (11) | 26.2 ( 9) | 28.6 (10) | 37.3 ( 7) | 44.0 (10) | 36.8 (10) | 45.6 (11) | 63.0 ( 1) | |
| Jayawardene | 107 | 3229 | 30.18 | 31.1 (14) | 27.9 ( 7) | 31.5 (32) | 19.7 ( 9) | 29.2 (14) | 22.0 ( 8) | 43.0 ( 7) | 29.7 (13) | 46.7 ( 3) | |
| Lara | 85 | 3225 | 37.94 | 41.6 (15) | 37.9 (14) | 23.8 (11) | 44.2 (10) | 45.2 ( 6) | 33.8 (16) | 55.8 ( 6) | 31.4 ( 7) | ||
| S Waugh | 136 | 3165 | 23.27 | 22.9 (15) | 21.0 (14) | 16.4 (22) | 24.7 (24) | 29.4 (19) | 20.8 (12) | 22.1 (27) | 56.7 ( 3) | ||
| Azharuddin | 102 | 3163 | 31.01 | 27.4 (14) | 40.3 (10) | 37.2 (13) | 17.7 ( 7) | 31.8 (13) | 30.9 (18) | 27.8 (19) | 37.6 ( 7) | 9.0 ( 1) | |
| Boon | 97 | 3132 | 32.29 | 26.2 ( 9) | 46.1 (14) | 29.6 (20) | 31.9 (10) | 26.4 ( 8) | 36.2 (10) | 26.7 (23) | 51.3 ( 3) | ||
| Ganguly | 75 | 3110 | 41.47 | 27.8 (13) | 47.2 ( 5) | 56.6 ( 7) | 21.8 (13) | 52.9 ( 7) | 54.5 ( 8) | 53.2 ( 8) | 46.2 (12) | 22.5 ( 2) | |
| Gayle | 90 | 3072 | 34.13 | 35.2 (13) | 30.5 (11) | 40.9 (12) | 47.6 ( 5) | 32.1 ( 9) | 28.3 (17) | 31.3 ( 6) | 35.9 (16) | 18.0 ( 1) | |
| Sangakkara | 96 | 3025 | 31.51 | 43.8 (12) | 22.6 ( 7) | 29.1 (27) | 28.7 ( 6) | 25.0 (15) | 53.6 ( 7) | 38.5 ( 6) | 18.8 (12) | 44.2 ( 4) | |
| Fleming | 101 | 2975 | 29.46 | 26.8 (20) | 27.7 (10) | 28.2 (12) | 35.1 (14) | 33.4 (10) | 24.3 (14) | 31.3 (10) | 31.4 (11) | ||
| Clarke | 86 | 2941 | 34.2 | 32.4 (12) | 27.2 (13) | 34.1 (12) | 55.0 ( 9) | 14.8 ( 6) | 48.6 (17) | 32.4 ( 7) | 18.1 ( 7) | 8.7 ( 3) |
Tendulkar's RpI value is 52.0 against Australia at home. The other notable RpI values at home are Jones vs England (58.5), Kallis vs India (46.2), Tendulkar vs New Zealand (51.3), Jones vs Pakistan (42.8), Tendulkar vs South Africa (45.2), Gilchrist vs Sri Lanka (58.6), Mark Waugh vs West Indies (45.3) et al.
| Batsman | Inns | Runs | RpI | vs AUS | vs ENG | vs IND | vs NZL | vs PAK | vs SAF | vs SLK | vs WIN | vs B/Z | vs OTH |
|---|---|---|---|---|---|---|---|---|---|---|---|---|---|
| Away matches | RpI (I) | RpI (I) | RpI (I) | RpI (I) | RpI (I) | RpI (I) | RpI (I) | RpI (I) | RpI (I) | RpI (I) | |||
| Ponting | 129 | 5089 | 39.45 | 41.8 (20) | 43.6 (25) | 38.3 (18) | 65.0 ( 3) | 42.1 (18) | 39.2 (15) | 24.4 (18) | 41.9 (11) | 33.0 ( 1) | |
| Tendulkar | 146 | 5065 | 34.69 | 29.6 (25) | 37.6 (17) | 36.2 (18) | 36.9 (13) | 25.1 (22) | 36.5 (28) | 36.3 ( 6) | 47.7 (14) | 30.7 ( 3) | |
| Sangakkara | 123 | 4426 | 35.98 | 38.1 (28) | 34.6 (14) | 40.3 (17) | 30.4 (14) | 57.4 ( 7) | 28.4 (18) | 16.6 ( 7) | 43.7 (15) | 26.3 ( 3) | |
| Jayasuriya | 147 | 4087 | 27.8 | 23.0 (27) | 41.4 (13) | 22.5 (25) | 31.4 (20) | 30.8 (19) | 20.7 (18) | 42.3 ( 6) | 22.6 (16) | 55.0 ( 3) | |
| Dravid | 113 | 4044 | 35.79 | 29.5 (13) | 32.4 (20) | 35.4 (12) | 45.7 (11) | 46.5 (11) | 33.4 (22) | 29.7 (11) | 40.4 (10) | 36.0 ( 3) | |
| Inzamam | 127 | 3932 | 30.96 | 27.2 (22) | 28.8 (13) | 45.9 (12) | 24.0 (23) | 26.4 (17) | 27.8 (13) | 43.1 (13) | 37.6 (11) | 23.7 ( 3) | |
| Richards | 82 | 3921 | 47.82 | 50.1 (38) | 57.4 (15) | 41.4 (12) | 66.5 ( 2) | 35.0 (15) | |||||
| Kallis | 101 | 3708 | 36.71 | 28.5 (21) | 25.9 (14) | 52.7 (11) | 32.9 (14) | 29.5 (11) | 41.9 ( 8) | 46.1 (17) | 59.3 ( 3) | 42.5 ( 2) | |
| Gilchrist | 107 | 3642 | 34.04 | 38.0 (13) | 37.8 (19) | 34.9 (18) | 63.3 ( 3) | 29.7 (20) | 23.9 ( 9) | 30.0 (14) | 35.4 ( 9) | 31.5 ( 2) | |
| Jayawardene | 131 | 3557 | 27.15 | 31.5 (30) | 46.9 (14) | 24.5 (17) | 14.8 (13) | 23.6 (10) | 22.6 (16) | 27.9 ( 7) | 22.6 (20) | 25.8 ( 4) | |
| Ganguly | 98 | 3468 | 35.39 | 24.6 ( 9) | 35.3 (16) | 22.2 (12) | 35.0 ( 8) | 43.4 ( 9) | 39.0 (20) | 43.0 ( 6) | 36.4 (15) | 53.3 ( 3) | |
| Mohd Yousuf | 102 | 3456 | 33.88 | 24.8 (18) | 29.8 (15) | 36.9 (14) | 29.3 (10) | 35.7 (12) | 19.2 (12) | 22.9 ( 9) | 73.2 (11) | 83.0 ( 1) | |
| Yuvraj Singh | 101 | 3377 | 33.44 | 29.4 (11) | 35.6 (14) | 21.3 (11) | 47.5 (12) | 16.7 ( 9) | 34.9 (22) | 40.2 ( 9) | 36.2 (12) | 38.0 ( 1) | |
| Chanderpaul | 82 | 3222 | 39.29 | 45.5 ( 8) | 45.9 ( 8) | 36.2 (16) | 29.4 (12) | 53.7 ( 3) | 42.5 (17) | 21.8 ( 4) | 41.8 (11) | 43.0 ( 3) | |
| Lara | 93 | 3212 | 34.54 | 35.3 (27) | 28.8 ( 9) | 31.9 (14) | 40.3 ( 9) | 22.9 ( 9) | 30.3 (13) | 53.4 ( 5) | 46.1 ( 7) | ||
| Dilshan | 95 | 3089 | 32.52 | 23.9 (21) | 5.3 ( 9) | 45.9 (16) | 26.6 ( 7) | 38.9 (10) | 40.7 ( 7) | 24.2 ( 6) | 38.2 (16) | 63.0 ( 3) | |
| M Waugh | 80 | 3059 | 38.24 | 51.4 ( 7) | 44.9 ( 8) | 46.2 (18) | 33.7 ( 6) | 23.4 (14) | 35.6 ( 9) | 31.1 (16) | 80.0 ( 2) | ||
| Atapattu | 92 | 3055 | 33.21 | 34.3 (15) | 34.4 ( 7) | 21.8 (17) | 34.0 (13) | 48.2 (11) | 39.4 (15) | 23.8 ( 4) | 27.6 ( 9) | 23.0 ( 1) | |
| Haynes | 101 | 3033 | 30.03 | 30.7 (51) | 17.4 ( 7) | 26.0 (13) | 32.6 ( 5) | 33.5 (20) | 33.3 ( 3) | 37.0 ( 2) | |||
| Gayle | 77 | 2943 | 38.22 | 13.7 (10) | 42.5 (11) | 46.0 (12) | 31.1 (10) | 14.2 ( 4) | 32.3 ( 6) | 20.2 ( 6) | 57.2 (13) | 72.2 ( 5) | |
| de Silva | 97 | 2927 | 30.18 | 30.2 (24) | 20.8 ( 4) | 32.0 (20) | 23.0 (13) | 28.1 (15) | 22.5 (13) | 16.0 ( 2) | 83.8 ( 4) | 48.0 ( 2) | |
| Sehwag | 86 | 2915 | 33.9 | 17.1 (12) | 26.1 ( 7) | 49.8 (12) | 44.9 ( 9) | 15.0 ( 7) | 31.9 (19) | 36.2 ( 8) | 43.7 (12) |
The stand-out performance is that of Richards who has an RpI value of 50.1 vs Australia in away matches. He also has 57.4 against England. Kallis averages over 50 per innings vs India. Dravid, 46.5 vs South Africa. Azharuddin has been the best visitor to Sri Lanka with an RpI of 45.3. The one who relished the West Indian attack most was Kallis with 46.1.
| Batsman | Inns | Runs | RpI | vs AUS | vs ENG | vs IND | vs NZL | vs PAK | vs SAF | vs SLK | vs WIN | vs B/Z | vs OTH |
|---|---|---|---|---|---|---|---|---|---|---|---|---|---|
| Neutral matches | RpI (I) | RpI (I) | RpI (I) | RpI (I) | RpI (I) | RpI (I) | RpI (I) | RpI (I) | RpI (I) | RpI (I) | |||
| Tendulkar | 146 | 6385 | 43.73 | 51.7 (15) | 46.2 ( 4) | 39.6 ( 7) | 38.6 (39) | 34.9 (13) | 40.5 (25) | 42.4 (16) | 46.7 (18) | 72.9 ( 9) | |
| Jayasuriya | 162 | 5463 | 33.72 | 18.3 ( 6) | 37.2 (12) | 36.0 (21) | 39.4 (16) | 33.3 (44) | 33.0 (15) | 26.4 (17) | 41.5 (22) | 21.8 ( 9) | |
| Saeed Anwar | 135 | 5353 | 39.65 | 27.5 (10) | 33.3 ( 3) | 39.9 (39) | 45.0 (14) | 21.2 ( 9) | 48.4 (38) | 30.8 (12) | 51.7 ( 6) | 20.5 ( 4) | |
| Inzamam | 159 | 5133 | 32.28 | 25.9 ( 9) | 21.2 ( 5) | 32.3 (40) | 51.5 (10) | 22.1 (11) | 40.3 (36) | 26.1 (29) | 36.9 (13) | 9.2 ( 6) | |
| Ganguly | 127 | 4785 | 37.68 | 17.4 (11) | 34.8 ( 5) | 34.8 (12) | 37.5 (29) | 42.5 (13) | 26.4 (12) | 35.2 (13) | 38.2 (19) | 66.4 (13) | |
| Lara | 111 | 3969 | 35.76 | 35.0 ( 8) | 1.2 ( 4) | 28.9 (15) | 37.6 ( 7) | 39.2 (33) | 35.6 ( 8) | 37.2 (14) | 38.0 (16) | 46.5 ( 6) | |
| de Silva | 133 | 3950 | 29.7 | 65.0 ( 5) | 29.6 ( 9) | 26.7 (15) | 20.5 (13) | 35.2 (46) | 22.1 (11) | 16.4 (22) | 41.5 (11) | 10.0 ( 1) | |
| Jayawardene | 113 | 3810 | 33.72 | 24.0 ( 4) | 34.9 (10) | 35.2 (22) | 55.6 (10) | 29.6 (31) | 18.3 (11) | 30.2 ( 4) | 24.7 (12) | 55.4 ( 9) | |
| S Afridi | 160 | 3539 | 22.12 | 11.4 (14) | 19.5 ( 8) | 19.6 (37) | 32.5 (15) | 26.3 (13) | 24.3 (34) | 17.3 (19) | 33.8 (12) | 13.9 ( 8) | |
| Mohd Yousuf | 105 | 3497 | 33.3 | 47.2 ( 8) | 0.0 ( 1) | 40.1 (16) | 28.6 (11) | 15.9 (12) | 35.2 (23) | 38.9 (14) | 26.3 ( 9) | 34.6 (11) | |
| Dravid | 114 | 3439 | 30.17 | 13.8 (10) | 47.0 ( 3) | 26.1 (10) | 28.4 (33) | 32.5 (11) | 39.0 ( 9) | 28.8 (16) | 31.7 (13) | 42.3 ( 9) | |
| Saleem Malik | 122 | 3411 | 27.96 | 33.2 ( 4) | 22.9 ( 8) | 30.8 (39) | 30.1 ( 9) | 22.0 ( 5) | 31.2 (26) | 24.6 (24) | 19.0 ( 6) | 0.0 ( 1) | |
| Azharuddin | 121 | 3411 | 28.19 | 26.8 (13) | 29.2 ( 5) | 22.9 (13) | 31.2 (47) | 29.6 ( 8) | 38.6 (12) | 19.5 (15) | 20.2 ( 8) | ||
| Ranatunga | 116 | 3315 | 28.58 | 29.3 ( 3) | 26.2 ( 9) | 26.0 (13) | 24.3 (15) | 27.8 (40) | 22.8 ( 8) | 35.5 (17) | 34.2 (10) | 50.0 ( 1) | |
| Ijaz Ahmed | 122 | 3285 | 26.93 | 9.0 ( 5) | 30.3 ( 7) | 26.1 (39) | 26.1 (10) | 36.0 ( 7) | 30.0 (28) | 28.7 (22) | 6.2 ( 4) | ||
| Ponting | 86 | 3208 | 37.3 | 54.0 ( 4) | 35.2 (16) | 31.1 (13) | 35.3 (12) | 34.0 ( 8) | 52.8 ( 5) | 32.8 ( 8) | 44.2 (10) | 36.1 (10) | |
| Haynes | 87 | 3042 | 34.97 | 17.0 ( 3) | 29.8 (13) | 37.6 (15) | 6.5 ( 2) | 37.7 (37) | 29.0 ( 2) | 34.1 (12) | 55.0 ( 3) | ||
| Sangakkara | 87 | 3021 | 34.72 | 28.2 ( 4) | 17.0 ( 6) | 42.2 (18) | 32.0 (10) | 29.8 (17) | 39.4 ( 9) | 13.0 ( 2) | 43.8 (12) | 34.9 ( 9) | |
| Atapattu | 96 | 2915 | 30.36 | 15.0 ( 2) | 14.3 ( 9) | 31.3 (12) | 24.9 ( 9) | 34.7 (29) | 25.2 (13) | 4.0 ( 4) | 47.3 (15) | 31.7 ( 3) | |
| J Miandad | 82 | 2832 | 34.54 | 42.0 ( 4) | 41.1 ( 9) | 39.9 (13) | 42.7 ( 3) | 31.9 (14) | 30.1 (36) | 39.3 ( 3) | |||
| Fleming | 96 | 2747 | 28.61 | 24.5 (13) | 31.3 ( 6) | 31.9 (12) | 24.7 (15) | 36.1 (15) | 11.2 (13) | 27.8 ( 6) | 45.8 ( 8) | 33.5 ( 8) | |
| Kallis | 75 | 2689 | 35.85 | 35.3 ( 3) | 30.0 ( 5) | 42.3 (10) | 35.9 (15) | 29.8 (15) | 46.9 ( 8) | 16.6 ( 5) | 44.4 ( 5) | 38.2 ( 9) |
Tendulkar has an RpI value of 51.7 vs Australia in neutral locations. Saeed Anwar likes the New Zealand attack with an RpI value of 45.0. Inzamam has 51.5. Saeed Anwar also has an RpI value of 48.4 vs Sri Lanka.
To download/view the Excel sheet containing the following tables, please click/right-click here. The serious students of the game are going to have a link to this Excel file on their desktop and refer to it a few times a day.
Batsman location summary and key tournament match performances.
Batsmen run analysis vs Team - for all matches
Batsmen run analysis vs Team - for home matches
Batsmen run analysis vs Team - for away matches
Batsmen run analysis vs Team - for neutral matches
I am not going to do too much of work on the conclusions which can be drawn. This is not that type of article. Just a minimalistic set of statements.
There is a need to mention three players. I can already hear the reader or two saying "So! what's new: we know that already".
The first (amongst equals) is Tendulkar. A career which is almost the definition of consistency, not in any narrow numbers-based sense, but based on a broad definition. An RpI value exceeding 35 in almost all classifications, exceeding 40 in many classifications, no real failures (barring one: away against South Africa), tons of runs, all at an excellent strike rate. What more can one want.
The next one is Richards. Not many runs, by today's standards, but understandable. But almost all top quality runs, a very high career RpI, an away RpI which exceeds the already high career RpI, most of the runs scored away from home and all at a wonderful strike rate. An RpI value of 47+ in the key tournament matches adds to his aura.
The third one is Ponting. His overall numbers speak for themselves. Above-par performances in all locations and above-average against all countries. However what clinched this special inclusion is his tally of runs and RpI in the key tournament matches. These have contributed significantly to the team cause in winning three World Cups and two ICC Champions Trophies.
Three jewels in the crown, that is all one can say.
I can hear a few readers asking me "why not complete the batting line-up?". A valid request. So I will give you my three additional players to go with these three jewels to complete the top-6 batting line-up. Gilchrist (to open with Tendulkar), Lara (at 4/5) and Pietersen (Bevan/Hussey ???). This leaves the seventh spot for a truly great all-rounder (Shakib Al Hassan, anyone? Averages of 35+ and 28+, playing for Bangladesh).
Anantha Narayanan has written for ESPNcricinfo and CastrolCricket and worked with a number of companies on their cricket performance ratings-related systems