A 19-year low for England's pace attack
The highlight of the series was the manner in which South Africa's batsmen dominated England's strong bowling attack in home conditions
S Rajesh
21-Aug-2012
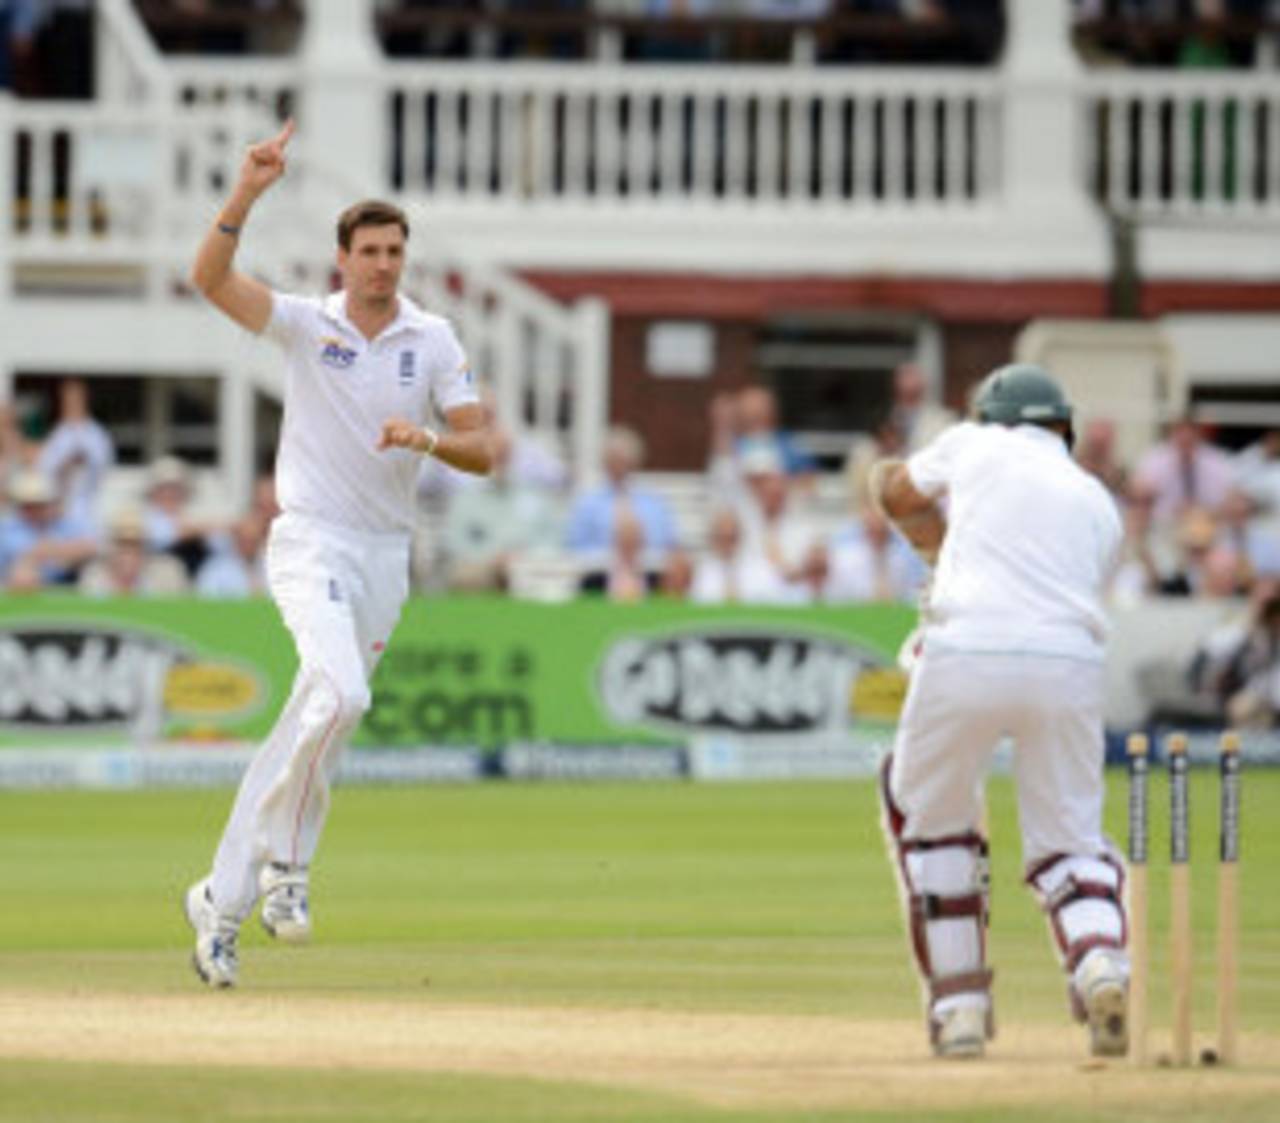
Hashim Amla was dismissed twice by Steven Finn in 65 balls, but Anderson, Bresnan, Broad and Swann couldn't get him out even once in 650 deliveries • PA Photos
When the series began, England, it seemed, had an edge: they were playing at home, they had the better spinner, and South Africa's team composition had been affected by the career-ending injury to Mark Boucher. As it turned out, South Africa dominated most of the play, inflicting upon England their first defeat by a two-Test margin in a home series since the 2001 Ashes. It was also the first time in nine series since South Africa's readmission that either of these two teams has beaten the other by a margin of more than one Test. Here's a look at some of the key numbers from the series.
The overall stats
The stat that perhaps best illustrates South Africa's dominance is the overall batting average: South Africa scored 48 runs per wicket, which is 45% higher than England's average. That's obviously because of the Oval Test, when South Africa scored 637 for 2 and England 625 for 20. In the last two Tests, there was no difference: South Africa averaged 34.28, and England 34.23. In fact, most of the numbers in this series will be skewed because of the first Test, but it's astonishing that a No.1 team - and one that seemed to possess such good all-round skills - could be outclassed so comprehensively, especially in a home Test.
The stat that perhaps best illustrates South Africa's dominance is the overall batting average: South Africa scored 48 runs per wicket, which is 45% higher than England's average. That's obviously because of the Oval Test, when South Africa scored 637 for 2 and England 625 for 20. In the last two Tests, there was no difference: South Africa averaged 34.28, and England 34.23. In fact, most of the numbers in this series will be skewed because of the first Test, but it's astonishing that a No.1 team - and one that seemed to possess such good all-round skills - could be outclassed so comprehensively, especially in a home Test.
South Africa's batsmen were also better at converting their starts into huge scores: Hashim Amla, Jacques Kallis and Alviro Petersen all made 150-plus scores; for England, the highest in the series was Kevin Pietersen's 149. Of the ten 50-plus scores for South Africa, five were converted into centuries; for England, that count was only two out of 11.
| Team | Runs scored | Wickets taken | Bat ave | 100s/ 50s |
| South Africa | 1974 | 54 | 48.14 | 5/ 5 |
| England | 1789 | 41 | 33.12 | 2/ 9 |
South Africa's top-class top order
South Africa had the edge in terms of top-order batting going into the series, but the margin by which they trumped England was surprising.
South Africa had the edge in terms of top-order batting going into the series, but the margin by which they trumped England was surprising.
Battle of the captains: Smith v Strauss, two left-hand opening batsmen also leading their teams, and both playing their 100th Tests in the series. But there the similarities ended. Smith scored a century in his 100th and set the platform for South Africa's utter domination in that match, and also chipped in with two half-centuries in the second Test; Strauss, on the other hand, struggled throughout the series, managing a highest score of 37 and an aggregate of 106 in six innings. In fact, Smith scored more runs in his first innings of the series than Strauss did in the entire series. And unlike Strauss, Smith didn't have other off-field issues to deal with.
His opening partner, Alastair Cook, started the series with a century but managed only 80 runs in his next five innings. Petersen played only one significant innings as well, but his monumental 182 at Headingley ensured South Africa didn't lose the plot after their win at The Oval. Five of South Africa's top seven batsmen averaged more than 50 - and the other two more than 35. For England, however, only the Pietersen-Bairstow combination (one played two Tests, the other one) averaged more than 50. Matt Prior impressed with his spunk and three fifties, but three of their top five averaged less than 35.
South Africa, on the other hand, had Amla, whose aggregate of 482 is the third-highest by a South African batsman in a series of not more than three Tests.
The partnerships: The difference in average opening partnerships was huge, and that set the tone for the rest of the innings. While South Africa had two century stands in five innings, England's highest opening partnership was 65, and the average was about a third of what South Africa managed. Similarly, South Africa's averages for the second, third and fourth wickets were also much higher than England's. Adding up the averages for the first four wickets, South Africa's total is 298.50, compared to England's 119.32.
England's lower order battled effectively - from fifth to eighth wickets, their average partnerships totalled 187, compared to South Africa's 136.75 - but the top-order gulf made all the difference.
| Wicket | SA-Runs | Ave stand | 100/ 50 p'ships | Eng-Runs | Ave stand | 100/ 50 p'ships |
| 1st | 309 | 61.80 | 2/ 0 | 122 | 20.33 | 0/ 1 |
| 2nd | 311 | 62.20 | 1/ 0 | 284 | 47.33 | 1/ 1 |
| 3rd | 537 | 134.25 | 1/ 2 | 207 | 34.50 | 0/ 2 |
| 4th | 161 | 40.25 | 0/ 1 | 103 | 17.16 | 0/ 0 |
| 5th | 151 | 37.75 | 0/ 2 | 435 | 87.00 | 2/ 2 |
| 6th | 140 | 35.00 | 0/ 2 | 184 | 36.80 | 0/ 1 |
| 7th | 128 | 32.00 | 0/ 1 | 174 | 34.80 | 0/ 1 |
| 8th | 128 | 32.00 | 0/ 1 | 142 | 28.40 | 0/ 1 |
England's 19-year low for pace
There was little to choose between the pace attacks of the two teams going into the series, but England had the advantage of knowing the conditions and the ball better than their opponents. However, South Africa dominated this aspect too, with only Steven Finn's stats comparing favourably to those of the South African pace attack. Over the entire series, England's pace attack conceded 47.71 runs per wicket in the series, which is their poorest performance in a home series since the 1993 Ashes, when they averaged 54.40.
There was little to choose between the pace attacks of the two teams going into the series, but England had the advantage of knowing the conditions and the ball better than their opponents. However, South Africa dominated this aspect too, with only Steven Finn's stats comparing favourably to those of the South African pace attack. Over the entire series, England's pace attack conceded 47.71 runs per wicket in the series, which is their poorest performance in a home series since the 1993 Ashes, when they averaged 54.40.
Perhaps the biggest disappointment among the fast bowlers was James Anderson. Over the last few years he had taken over the mantle of lead strike bowler, but here he managed only nine wickets at 40.67, his worst series average since the 2009 Ashes, when he took 12 wickets at 45.16, and his second-poorest average ever in a home series. Between that Ashes performance in 2009 and this one, Anderson had taken 127 wickets in 28 Tests at 24.74. Anderson's lack of success meant the fight between him and Dale Steyn turned into a no-contest: Steyn's 15 wickets in the series came at an average of 29.20. (Click here for the series averages for South Africa, and here for England.)
Spin bowling, and Graeme Swann, was supposed to be a huge advantage for England, but South Africa's batsmen handled Swann superbly, allowing him only four wickets at an average of 77. Not surprisingly, this was Swann's worst series too: his previous highest bowling average in a series was 47, earlier this season against West Indies. That two of his worst series have come in the same season will be another cause for worry for England.
England's overall spin average was only 45.11 because of Pietersen, whose offspin yielded a series haul of 4 for 91. In contrast, Imran Tahir's eight wickets came at 47.25. Not earthshattering stuff, but then this wasn't a series for spin bowling.
| Bowling type | Wickets | Average | Strike rate | Econ rate | 5WI/ 10WM |
| South Africa - pace | 42 | 30.52 | 63.5 | 2.87 | 2/ 0 |
| England - pace | 32 | 47.71 | 89.8 | 3.18 | 1/ 0 |
| South Africa - spin | 9 | 45.11 | 85.1 | 3.18 | 0/ 0 |
| England - spin | 8 | 49.87 | 106.7 | 2.80 | 0/ 0 |
| Series | Tests | Wickets | Average | Strike rate | 5WI/ 10WM |
| The Ashes, 1930 | 5 | 13 | 68.84 | 163.0 | 0/ 0 |
| The Ashes, 1989 | 6 | 52 | 57.17 | 107.9 | 0/ 0 |
| The Ashes, 1993 | 6 | 45 | 54.40 | 101.2 | 1/ 0 |
| West Indies in England, 1950 | 4 | 16 | 50.50 | 128.3 | 1/ 0 |
| South Africa in England, 2012 | 3 | 32 | 47.71 | 89.8 | 1/ 0 |
The head-to-head battles
And finally, a look at how some of the key head-to-head contests went in the series. Amla dominated all bowlers except Finn, who dismissed him twice in 65 balls, conceding only 22 runs; Anderson, Tim Bresnan, Stuart Broad and Swann bowled 650 deliveries to him in the series but didn't dismiss him once. Swann, meanwhile, bowled more than 100 deliveries to four batsmen in the series - Amla, Duminy, Kallis and Smith - and the only one he dismissed among them was Smith. In fact, Swann took only two top-order wickets in the entire series - Smith and Jacques Rudolph. His other two victims were Philander and Morkel. Anderson had a tough time against most batsmen, but especially against left-handers, getting only two of their wickets - those of Smith and Duminy - in 320 balls.
Steyn wasn't given the first new ball through the entire series so that he didn't have to bowl to left-handers at the start, and he'd have a better chance to stay fresh when Trott came in to bat. The move worked superbly, as is evident from Steyn's stats against Trott in the series: four dismissals for 46 runs, and an average of 11.50. In fact, Trott was the only batsman from either team to be dismissed four times by a bowler in the series. His overall Test stats against Steyn don't make pretty reading either: seven dismissals for 65 runs in 150 balls, at an average of 9.28. Steyn had fine figures against Cook too, but Pietersen took him apart in a superb onslaught at Headingley.
One of the huge disappointments for England was Ian Bell, who fought hard for two fifties but never managed the kind of runs that was expected from a top-order batsman. He stayed at the crease for long periods but struggled to get the ball away: over the entire series, he played 533 deliveries for 144 runs, a scoring rate of 1.62 runs per over. Against Steyn, Morkel and Philander, he took 307 deliveries to score 66 runs, a rate of 1.29 runs per over. Matt Prior took the fight to the bowlers throughout the series, just as Pietersen had at Headingley, but England needed more such efforts, and a far more incisive bowling display, against a team which has rightfully taken over the mantle of top Test side.
| Batsman | Bowler | Balls | Runs | Dismissals | Average | Run rate |
| Hashim Amla | Steven Finn | 65 | 22 | 2 | 11.00 | 2.03 |
| Hashim Amla | Anderson, Bresnan, Broad, Swann | 650 | 385 | 0 | - | 3.55 |
| Jacques Kallis | Steven Finn | 27 | 14 | 2 | 7.00 | 3.11 |
| Amla, Duminy, Kallis, Smith | Graeme Swann | 539 | 232 | 1 | 232.00 | 2.58 |
| Right-handers | James Anderson | 568 | 248 | 7 | 35.42 | 2.61 |
| Left-handers | James Anderson | 320 | 115 | 2 | 57.50 | 2.15 |
| Jonathan Trott | Dale Steyn | 114 | 46 | 4 | 11.50 | 2.42 |
| Kevin Pietersen | Dale Steyn | 94 | 74 | 0 | - | 4.72 |
| Alastair Cook | Dale Steyn | 107 | 58 | 3 | 19.33 | 3.25 |
| Alastair Cook | Vernon Philander | 104 | 45 | 3 | 15.00 | 2.59 |
| Ian Bell | Steyn, Morkel, Philander | 307 | 66 | 3 | 22.00 | 1.29 |
| Matt Prior | Steyn, Morkel | 160 | 130 | 1 | 130.00 | 4.87 |
S Rajesh is stats editor of ESPNcricinfo. Follow him on Twitter