At home across the world
Sachin Tendulkar's Test stats reflect consistency over a staggeringly long period, with the highlight being his numbers outside the subcontinent
S Rajesh
Nov 18, 2013, 2:22 PM
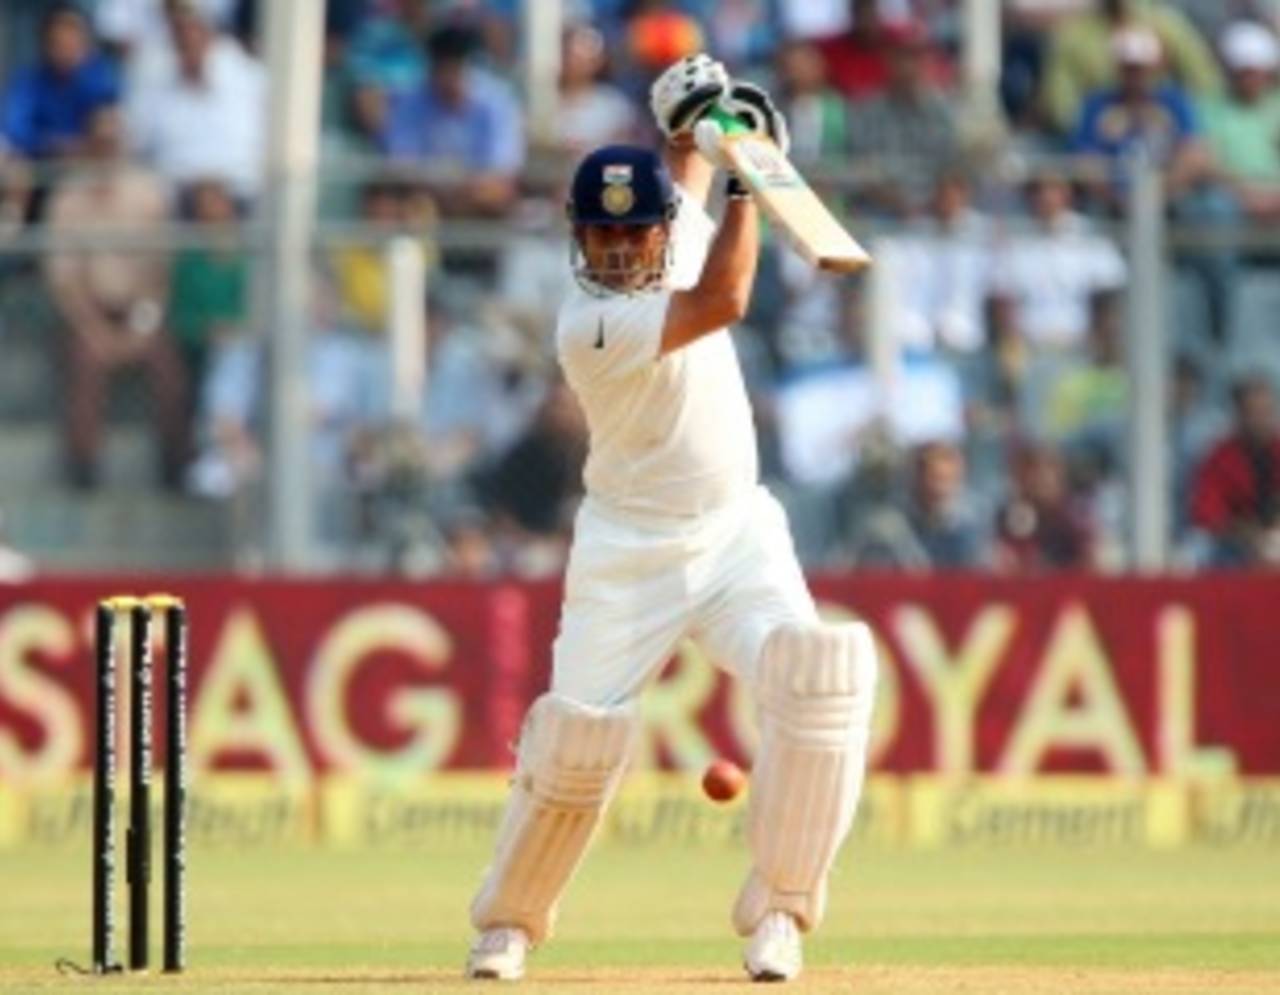
In the ten-year period between 1993 and 2002, Sachin Tendulkar's Test average of 62.30 was the best by a distance • BCCI
Fifteen thousand nine hundred and twenty-one. That's the new benchmark for longevity, consistency and durability that all Test batsmen will be measured against, for that's the final tally of Test runs that Sachin Tendulkar has finished with, in a 24-year journey that has combined flair and natural talent with relentless hard work and single-minded focus. Without either attribute he wouldn't have been able to succeed as much, and as consistently, as he did over an incredibly long period of time.
Apart from the sheer length of his career, what stands out is his consistency, both over different phases of his career, and in different conditions against different opposition. Against no team did he average less than 42 - the lowest averages were against Pakistan (42.28) and South Africa (42.46).
Even more impressively, he averaged at least 40 in every country he played in, unlike some of the other top batsmen who've had problems in at least one country. (Brian Lara averaged less than 40 in New Zealand and India, Jacques Kallis in England and Sri Lanka, Ricky Ponting in India, Inzamam-ul-Haq in Australia and South Africa, and Rahul Dravid in South Africa and Sri Lanka.) Tendulkar's lowest average, quite surprisingly, was in Zimbabwe - 40 in seven innings; it was also the only country where he didn't score a Test century. (Click here for Tendulkar's career summary as a Test batsman.)
What also stood out was how well he did outside the subcontinent: he averaged more than 50 in Australia and England, 49.52 in New Zealand, and 46.44 in South Africa, countries where subcontinent batsmen have often struggled.
Tendulkar's consistency also shines through when his career is split into blocks of 50 Tests. The lowest he averaged in one of those four blocks was 46.91, between Tests 101 and 150, a period during which he was also beset by tennis-elbow problems. Apart from that spell, his least productive period was the last couple of years, when his average dropped to 27.52 from 15 Tests, with no hundreds in 24 innings. At the end of 2011, Tendulkar averaged 56, but because of that lean spell, he finished at 53.78 (which is still outstanding by any standards). (Click here for his cumulative career average in Tests.)
| Period | Runs | Average | 100s/ 50s | |
| First 50 Tests | Nov 1989-Mar 1997 | 3438 | 49.82 | 11/ 16 |
| 51-100 Tests | Mar 1997-Sep 2002 | 4967 | 65.35 | 19/ 18 |
| 101-150 Tests | Oct 2002-Aug 2008 | 3472 | 46.91 | 9/ 15 |
| 151-200 Tests | Aug 2008-Nov 2013 | 4044 | 52.51 | 12/ 19 |
| Career | Nov 1989-Nov 2013 | 15,921 | 53.78 | 51/ 68 |
His best phase
In 1992, Tendulkar scored three hundreds, and all of them were masterpieces - 148 not out in Sydney, 114 in Perth, and 111 in Johannesburg. He was ready for bigger things, but he still finished with a calendar-year average of 41.90, because in the remaining eight innings that year he totalled 46 runs - his scores in those innings read 6,17,5,0,11,1,6,0 - clearly, he needed to become more consistent.
Being a quick learner, Tendulkar grasped that lesson fast, and over the next ten-year period he was the most prolific batsman in world cricket. That was also the time when most opposition teams had a couple of world-class fast bowlers in their ranks: the overall batting average in those ten years was 29.59; in the next 11-year period it went up to 32.67.
For Tendulkar, though, that period between 1993 and 2002 was when he was head and shoulders above all other batsmen in world cricket. He averaged 62.30 from 85 Tests; the next-best, Steve Waugh, averaged 55.07. His masterpieces during that period included 122 at Edgbaston in 1996, 169 in Cape Town the following year, 113 in Wellington in 1998, 136 against Pakistan in Chennai in 1999, 116 against Australia in Melbourne later that year, and 155 in Bloemfontein in 2001. That India ended up losing all six of those matches was a reflection of the rest of the batsmen, and the Indian bowling attack, that Tendulkar had to play with and carry along. Not all his hundreds were in defeats, though: he also scored nine in wins during that period, most famously conquering Shane Warne when scoring an unbeaten 155 in the second innings in Chennai in 1998.
| Batsman | Tests | Runs | Average | 100s/ 50s |
| Sachin Tendulkar | 85 | 7726 | 62.30 | 27/ 31 |
| Steve Waugh | 109 | 7765 | 55.07 | 25/ 33 |
| Rahul Dravid | 69 | 5614 | 53.46 | 14/ 28 |
| Matthew Hayden | 37 | 3079 | 53.08 | 12/ 10 |
| Andy Flower | 60 | 4630 | 52.02 | 12/ 25 |
| Jacques Kallis | 65 | 4455 | 50.62 | 11/ 25 |
| Brian Lara | 86 | 7328 | 50.53 | 18/ 34 |
| Inzamam-ul-Haq | 80 | 6056 | 50.46 | 17/ 31 |
| Ricky Ponting | 63 | 4246 | 48.80 | 14/ 17 |
| Mohammad Yousuf | 42 | 3099 | 48.42 | 10/ 16 |
Pace and bounce? No problem
What stood out, and differentiated him from other Indian batsmen during that period, was the way he performed outside the subcontinent. The period from his debut to the end of 2001 was one where he had to shoulder the bulk of the run-scoring burden on tours; the golden period for Dravid was to start from 2002. The difference between him and the other batsmen was especially glaring in Australia and South Africa, because Dravid and Sourav Ganguly did score runs in England and New Zealand. Between 1991 and 2001, Tendulkar scored six centuries in 17 Tests in Australia and South Africa; all the other Indian batsmen put together managed only eight. In fact, of the first 21 Tests Tendulkar played, only one was at home, while 16 were outside the subcontinent (including one in Zimbabwe). Tendulkar had little experience of these conditions, but he coped quite well.
The table below shows how badly the other Indian batsmen struggled in those conditions between 1991 and 2001. Mohammad Azharuddin scored only 472 runs in 21 innings despite getting two hundreds - 14 times in those 21 innings he was dismissed for 15 or fewer; Sanjay Manjrekar's highest in 16 innings on those tours was 46; Dilip Vengsarkar totalled 158 from 9 innings, while VVS Laxman scored 244 from 11, excluding that memorable 167 in Sydney. Amid such batting failures, Tendulkar was a shining exception: in four of those five series, he averaged more than 40. Overall in those 17 Tests, he scored 19% of the total runs that were scored by all the Indian batsmen.
| Batsman | Tests | Runs | Average | 100s/ 50s |
| Sachin Tendulkar | 17 | 1282 | 44.20 | 6/ 3 |
| Mohammad Azharuddin | 12 | 472 | 22.47 | 2/ 1 |
| Rahul Dravid | 8 | 472 | 31.46 | 1/ 2 |
| Sourav Ganguly | 8 | 469 | 31.26 | 0/ 3 |
| VVS Laxman | 7 | 411 | 41.10 | 1/ 1 |
| Kapil Dev | 9 | 367 | 26.21 | 1/ 1 |
| Ravi Shastri | 6 | 359 | 35.90 | 1/ 0 |
| Manoj Prabhakar | 9 | 336 | 24.00 | 0/ 3 |
| Sanjay Manjrekar | 9 | 313 | 22.35 | 0/ 0 |
| Pravin Amre | 4 | 169 | 33.80 | 1/ 0 |
| Dilip Vengsarkar | 5 | 158 | 17.55 | 0/ 2 |
The table below lists his percentage contribution to the total bat runs (excluding extras) that the team scored. It's clear that from 2002 his burden was considerably reduced. During Tendulkar's revival between 2009 and 2011 the percentage contribution went up to 16.87%, but in the last two years (15 Tests) it dropped to 8.75%.
| Period | Tendulkar's runs | Team runs | Percentage |
| Till Dec 1992 | 1085 | 9122 | 11.89 |
| Jan 1993 to Dec 2001 | 6334 | 32,048 | 19.76 |
| Jan '93 to Dec '01, in Aus, SA, NZ, Eng, WI | 1783 | 8368 | 21.31 |
| Jan 2002 onwards | 8502 | 59,863 | 14.20 |
| Overall | 15,921 | 101,033 | 15.76 |
The rock at No.4
Of the 329 innings Tendulkar played in his Test career, 275 were at the No. 4 position. For the first 22 innings of his Test career Tendulkar batted at No. 6 or 7, but the change happened after his unbeaten 148 against Australia in Sydney in 1992. In the second innings of the next Test, in Adelaide, Tendulkar moved up to No. 4 - above Vengsarkar and Azharuddin - as India looked to chase a stiff fourth-innings target of 372. He scored only 17 in that innings (Azharuddin scored a century as India lost by 38 runs), but the next game was in Perth, and Tendulkar's stunning 114 - in only his second innings at No.4 - settled matters. From the time he first batted at No. 4, only 29 times did he deviate from that position, mostly because of a nightwatchman coming in at No. 3 or 4.
At No. 4, he finished with 13,492 runs, 4574 more than the next-highest. Kallis and Greg Chappell have better averages, but it's unlikely any batsman will touch his aggregate at that position.
| Batsman | Innings | Runs | Average | 100s/ 50s |
| Sachin Tendulkar | 275 | 13,492 | 54.40 | 44/ 58 |
| Jacques Kallis | 168 | 8918 | 61.93 | 34/ 36 |
| Mahela Jayawardene | 177 | 8656 | 52.46 | 28/ 30 |
| Brian Lara | 148 | 7535 | 51.25 | 24/ 31 |
| Javed Miandad | 140 | 6925 | 54.10 | 19/ 31 |
| Mark Waugh | 170 | 6662 | 42.43 | 16/ 39 |
| Kevin Pietersen | 130 | 6199 | 49.59 | 19/ 25 |
| Gundappa Viswanath | 124 | 5081 | 43.05 | 12/ 31 |
| Inzamam-ul-Haq | 98 | 4867 | 52.90 | 15/ 21 |
| Martin Crowe | 106 | 4841 | 49.39 | 16/ 16 |
| Aravinda de Silva | 113 | 4543 | 44.10 | 15/ 16 |
| Greg Chappell | 86 | 4316 | 59.12 | 15/ 19 |
The table below lists Tendulkar's stats at No. 4 sorted by the team scores at which he came in to bat. Like you'd expect of any batsman, he was more prolific when the top three batsmen had given the team a good start: when he came in with the score reading 100 or more for the loss of two wickets, Tendulkar averaged 70.49, and scored 21 centuries from 97 such innings.
When he came in to bat very early - before India had scored 20 - Tendulkar's average dropped to 40.53. However, some of his most memorable innings came in such situations: when he scored 122 at Edgbaston against England in 1996, he came in at 17 for 2, and scored 122 out of a team total of 219. (The second-highest score in the innings was 18.) His 136 against Pakistan in Chennai came from an entry score of 6 for 2, while the Boxing Day 116 started from 11 for 2.
But it's also true that he was dismissed cheaply fairly often when he came in early: of the 37 times he came in at No. 4 before the total had reached 20, 15 times he was dismissed for single-digit scores.
However, his average went up to almost 51 when he came with the score between 20 and 49. Two of his double-centuries - 248 not out against Bangladesh and 214 against Australia - came from these entry scores, as did the 155 in Bloemfontein (2001) and the 146 in Cape Town (2011).
| Score | Innings | Runs | Average | 100s/ 50s |
| Less than 20 | 37 | 1459 | 40.53 | 5/ 5 |
| 21 to 49 | 68 | 3364 | 50.97 | 9/ 15 |
| 50-75 | 42 | 1409 | 40.26 | 4/ 8 |
| 76-99 | 31 | 1409 | 50.32 | 5/ 8 |
| 100-149 | 50 | 2640 | 61.39 | 9/ 9 |
| 150 and above | 47 | 3211 | 80.28 | 12/ 13 |
At his best against the best
One of the most impressive aspects of Tendulkar's career is his record against the best team of his generation. Towards the last few years of his career Australia were clearly not the best team around, but for nearly two decades they set the standard, and Tendulkar was pretty impressive against them in almost every series. In 39 Tests against them Tendulkar averaged 55, with 11 centuries in 74 innings. This, despite averaging only 34.21 in his last 15 innings against them. In Australia, he averaged 53.20 from 20 Tests, with six centuries. Only Jack Hobbs, who made 12 hundreds from 41 matches, has scored more centuries against Australia than Tendulkar.
Between 1990 and 2008, no batsman who played at least 20 innings against them averaged more than Tendulkar's 56.08. In 30 innings in Australia during this period, Tendulkar averaged 58.53. With a 12 innings cut-off, only Virender Sehwag (59.50) averaged more. In 35 innings that Lara played in Australia over the same period, he averaged 41.97.
| Batsman | Innings | Runs | Average | 100s/ 50s |
| Sachin Tendulkar | 55 | 2748 | 56.08 | 10/ 11 |
| VVS Laxman | 44 | 2204 | 55.10 | 6/ 10 |
| Kevin Pietersen | 20 | 963 | 53.50 | 2/ 6 |
| Virender Sehwag | 30 | 1483 | 51.13 | 3/ 7 |
| Brian Lara | 58 | 2856 | 51.00 | 9/ 11 |
| Ijaz Ahmed | 20 | 913 | 50.72 | 5/ 1 |
| Richie Richardson | 24 | 1084 | 49.27 | 4/ 4 |
| Shivnarine Chanderpaul | 29 | 1210 | 48.40 | 4/ 7 |
| Michael Vaughan | 20 | 959 | 47.95 | 4/ 1 |
| Graham Thorpe | 31 | 1235 | 45.74 | 3/ 8 |
The fourth-innings chink
The one aspect of his Test batting which was underwhelming was his performances in the fourth innings. He still holds the record for most runs in this aspect as well, but this one is unlikely to remain with him for too long: his aggregate of 1625 is only 50 more than the second-best, and 92 more than the best among active players (Graeme Smith's 1533). Tendulkar scored only 10.2% of his total runs in the fourth innings, compared to 17% for Smith.
Tendulkar's fourth-innings average of 36.93 is disappointing too: among the 21 other batsmen who've scored 1000-plus fourth-innings runs, 18 have a better average. One of them who doesn't, though, is Brian Lara: his 1440 runs in the last innings came at an average of 35.12. And then there's also the curious case of Steve Waugh, who scored only 613 fourth-innings runs at an average of 25.54.
More Tendulkar stats
With inputs from Shiva Jayaraman.
S Rajesh is stats editor of ESPNcricinfo. Follow him on Twitter