Bat second, finish first
Despite teams chasing down stiff targets far more easily this season, the absence of huge scores suggests a fairly even contest between bat and ball
Madhusudhan Ramakrishnan
18-Apr-2011
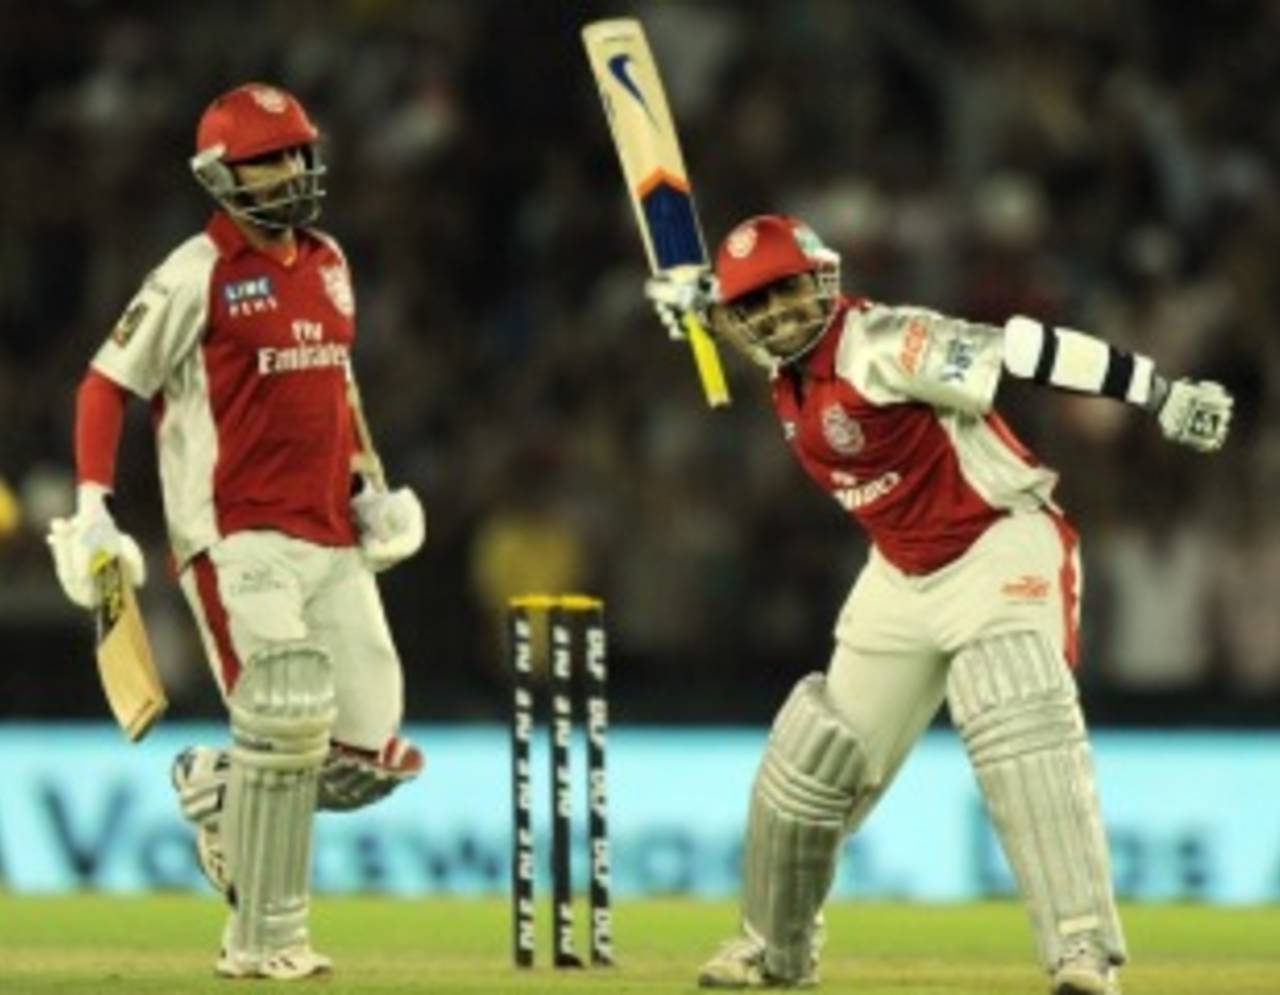
Kings XI Punjab have made the highest successful run-chase in IPL 2011 • AFP
Each of the four editions of the IPL has had one dominant trend. While the first one had a number of high scores, the second and third seasons were much more balanced, with spin proving to be a valuable wicket-taking and run-curtailing option. In this season so far, teams have been unable to make huge scores, but have chased competitive targets far more easily than in earlier seasons. Here is a look at some of the key stats from the first ten days of this tournament, and a comparison with the corresponding periods in 2008 and 2010, when the tournament was played in India. (IPL 2011 has had 17 matches in the first ten days. In the same duration, there were 16 games in 2010 and 14 in 2008.)
Teams struggle to defend
From the results of the matches played in the first ten days, IPL 2011 has been the most successful one for teams chasing. Thirteen out of 17 matches have been won by the teams batting second, an even better record than the first season, when chasing teams won ten of the first 14 games. The 2010 season in India was far more even, with teams batting first winning eight and losing seven of the first 16 games. The IPL 2008 and 2011 seasons have been quite similar in terms of successful chases of 150-plus scores: in 2008 a 150-plus target was chased successfully six times in the first ten days, compared to seven in the current tournament so far; in 2010, this happened only three times in the first ten days. From the table, it can be seen that both the average and run-rate for chasing teams have been significantly better than those of the teams batting first in the IPL 2008 and 2011 seasons. The stats for the first and second innings are however much closer in the 2010 season.
From the results of the matches played in the first ten days, IPL 2011 has been the most successful one for teams chasing. Thirteen out of 17 matches have been won by the teams batting second, an even better record than the first season, when chasing teams won ten of the first 14 games. The 2010 season in India was far more even, with teams batting first winning eight and losing seven of the first 16 games. The IPL 2008 and 2011 seasons have been quite similar in terms of successful chases of 150-plus scores: in 2008 a 150-plus target was chased successfully six times in the first ten days, compared to seven in the current tournament so far; in 2010, this happened only three times in the first ten days. From the table, it can be seen that both the average and run-rate for chasing teams have been significantly better than those of the teams batting first in the IPL 2008 and 2011 seasons. The stats for the first and second innings are however much closer in the 2010 season.
However, unlike in earlier seasons, teams in the 2011 season have not been able to post massive scores. There were seven 200-plus scores posted by teams in the first ten days of the first IPL season and five in the same period of the 2010 season. But so far, there has not been a single scores over 200 in this year's IPL. This could perhaps partially be explained by the fact the average run-rate of teams in the first six overs of the innings (7.21) has been much lower than the corresponding figure in IPL 2008 (8.07) and IPL 2010 (7.98).
Another surprise in the 2011 IPL has been the lack of close finishes. There have been only two wins by a margin of 15 runs or less, and one win with six balls or fewer remaining with the loss of five or more wickets. In contrast, there were five close games in the first ten days of IPL 2008 and seven (including a tied game) in the first 16 matches of IPL 2010.
| Season | Matches | Batting first (wins) | Chasing (wins) | Batting first (avg, RR) | Chasing (avg, RR) | 200-plus scores | Successful 150-plus chases |
| 2008 | 14 | 4 | 10 | 23.72, 8.51 | 34.07, 8.73 | 7 | 6 |
| 2010 | 16 | 8 | 7 | 25.87, 8.25 | 25.88, 8.02 | 5 | 3 |
| 2011 | 17 | 4 | 13 | 25.80, 7.75 | 35.88, 8.19 | 0 | 7 |
Bowlers have their say
The overall run-rate in the first season (8.61) remains the highest among the three editions played in India. The run-rate in the 2011 edition (7.96) is the lowest and only marginally higher than the overall run-rate in the first ten days of IPL 2009 played in South Africa (7.76). While the run-rate for the first-six over period in IPL 2011 is the lowest, the average is much better. The percentage of runs scored in boundaries has also decreased considerably in the later editions when compared to the first season.
The overall run-rate in the first season (8.61) remains the highest among the three editions played in India. The run-rate in the 2011 edition (7.96) is the lowest and only marginally higher than the overall run-rate in the first ten days of IPL 2009 played in South Africa (7.76). While the run-rate for the first-six over period in IPL 2011 is the lowest, the average is much better. The percentage of runs scored in boundaries has also decreased considerably in the later editions when compared to the first season.
In the first season, spinners bowled just five overs in the first-six over period of the first 14 matches. In 2010, they were extremely successful, bowling 26 overs in the same period and conceding just 6.23 runs per over. The performance of spinners in IPL 2011 has, however, been poorer: they have picked up just five wickets in the first-six over phase and have an economy rate of 7.44, which is higher than that of the pace bowlers (6.79). While IPL 2008 is still on top in terms of the scoring rate of teams in the last six, the run-rate in the 2011 season in the corresponding phase of the innings is 9.88, which is much higher than the figure for IPL 2010 (8.94).
| Season | Period of innings | Run rate | Average | Boundary% |
| 2008 | Overall | 8.61 | 27.72 | 61.96 |
| 2010 | Overall | 8.14 | 25.87 | 56.83 |
| 2011 | Overall | 7.96 | 29.98 | 55.18 |
| 2008 | First six overs | 8.07 | 27.20 | 71.61 |
| 2010 | First six overs | 7.98 | 31.30 | 63.10 |
| 2011 | First six overs | 7.21 | 31.95 | 62.85 |
| 2008 | Last six overs | 10.36 | 24.61 | 63.86 |
| 2010 | Last six overs | 8.94 | 20.07 | 56.06 |
| 2011 | Last six overs | 9.88 | 24.18 | 59.31 |
Spin still a key
The role of spinners has steadily gained importance after the first season when they were ineffective and sparingly used. In IPL 2008, they picked up only 36 wickets and conceded 8.12 runs per over. Despite not taking too many wickets in the second season in South Africa, their economy rate (6.62) was far better than that of the fast bowlers (8.04). In the 2011 season so far, spinners have picked up 57 wickets at 33.87. Although spinners have a better economy rate (7.55) than fast bowlers (7.94) in 2011, their average and economy rate are much higher than their corresponding numbers in the 2010 season.
The role of spinners has steadily gained importance after the first season when they were ineffective and sparingly used. In IPL 2008, they picked up only 36 wickets and conceded 8.12 runs per over. Despite not taking too many wickets in the second season in South Africa, their economy rate (6.62) was far better than that of the fast bowlers (8.04). In the 2011 season so far, spinners have picked up 57 wickets at 33.87. Although spinners have a better economy rate (7.55) than fast bowlers (7.94) in 2011, their average and economy rate are much higher than their corresponding numbers in the 2010 season.
| Season | Pace (wickets) | Pace (avg, ER) | Spin (wickets) | Spin (avg, ER) |
| 2008 | 109 | 29.86, 8.40 | 36 | 28.50, 8.12 |
| 2010 | 104 | 31.11, 8.31 | 56 | 28.60, 7.43 |
| 2011 | 98 | 31.44, 7.94 | 57 | 33.87, 7.55 |
There were six centuries scored in the 2008 IPL of which four came in the first ten days. The number of centuries fell to two in IPL 2009 in South Africa, but was back to four in the 2010 IPL in India. While the 2010 edition had just one century and 27 fifties in the first ten days of the tournament, there have been two hundreds and 26 fifties in the same period of this year's IPL. Interestingly, the first ten days of all three IPL editions held in India had the same number of 100-plus stands.
| Season | Number of 100s | Number of 50s | 100-plus stands |
| 2008 | 4 | 16 | 6 |
| 2010 | 1 | 27 | 6 |
| 2011 | 2 | 26 | 6 |