Why McCullum needs to lift his ODI game
Brendon McCullum's ODI form has dipped over the last three years, with most of his runs coming against weaker opposition
S Rajesh
24-Feb-2012
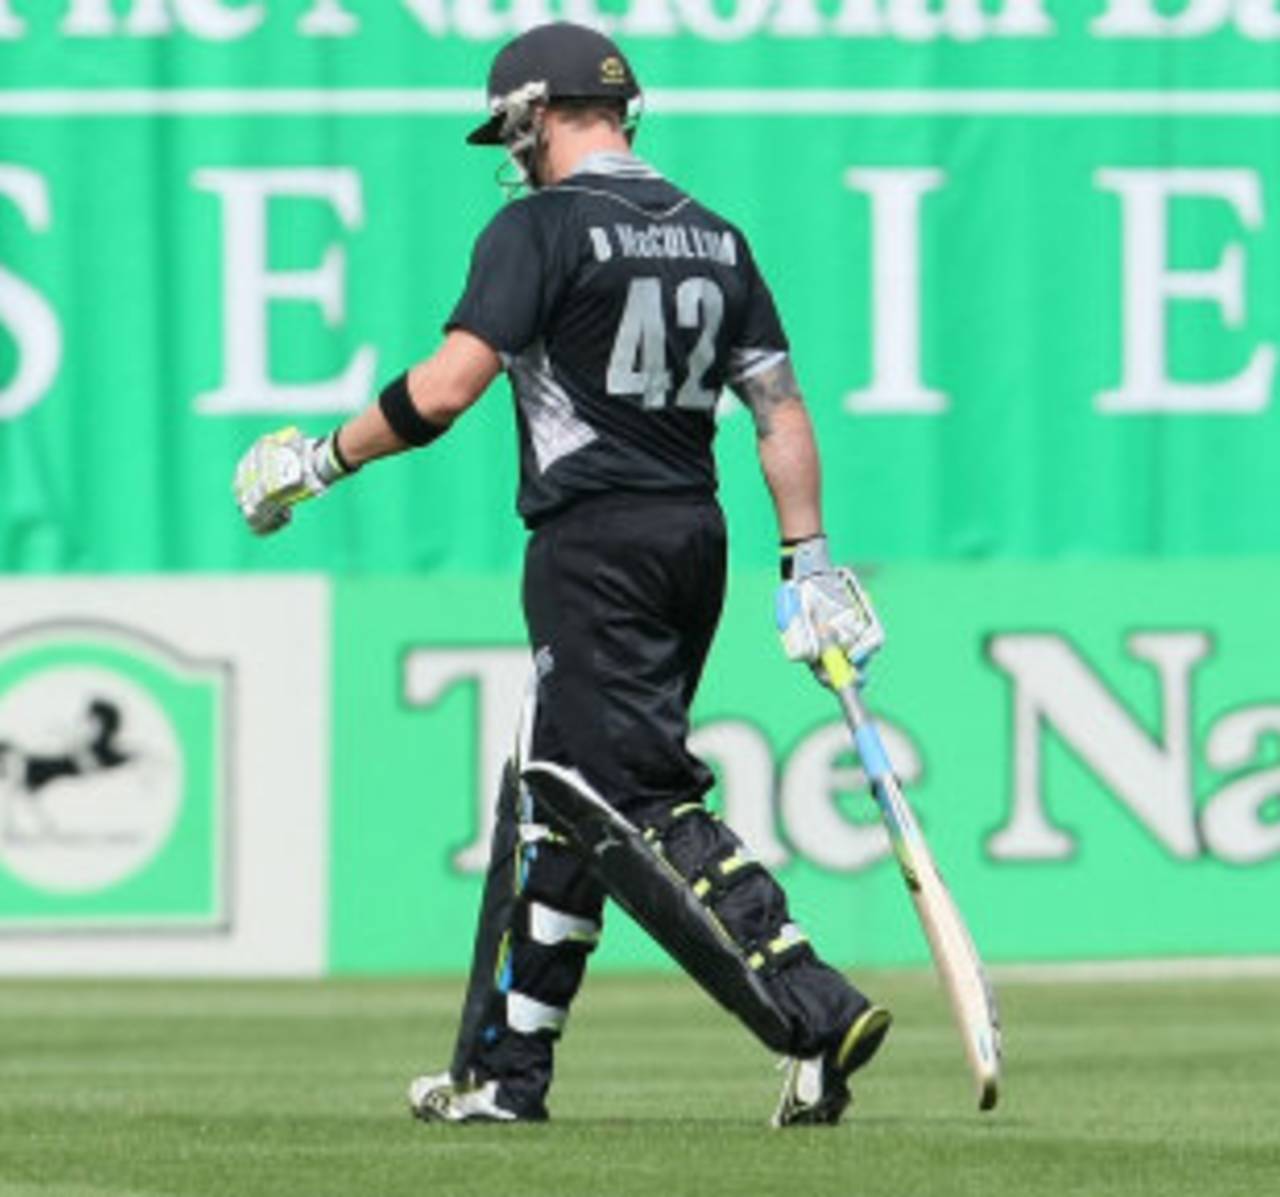
Brendon McCullum averages only 25.46 in his last 50 ODIs against the top eight teams • Getty Images
Brendon McCullum will most likely register a major milestone in the second one-day international between New Zealand and South Africa on February 29 - it'll be his 200th ODI, making him only the sixth New Zealander to achieve that feat. Given that he made his ODI debut in January 2002, it also means McCullum has already completed a decade in international cricket. Those are worthy numbers by themselves, and deserving of a small celebration, but when McCullum looks back at the kind of stats he has notched up during this period, he'll likely be a tad disappointed with his contributions as a batsman. His fans and those of New Zealand cricket will surely be dismayed at his lack of consistency with the bat.
Watching a McCullum innings is often an exercise in frustration. When in the mood, he can play all the shots in the book, and then some. The power, the timing, the hand-eye coordination, and the aggressive intent are all among the skills he possesses. And yet, the inability to put them all together for long enough periods consistently against the best sides means his career so far is one of underachievement, as a batsman at least.
The numbers clearly say so, and what's probably most disappointing is that his one-day performances have regressed over the last three years. Stats show that in the five years between 2004 and 2008, he'd managed a reasonable record, averaging almost 33 against all teams, and 30 against all sides except Zimbabwe and the other non-Test-playing nations. At the end of 2008, McCullum was 27 years old, with seven years of international experience already under his belt, and an integral member of the New Zealand team in all forms of the game.
The next few years should have been the time when he'd have taken his game to the next level, improving his consistency and playing a more meaningful role in a team whose batting has always been fragile, but in the last three years his ODI batting has continued to be patchy. In his last 56 innings, most of which were at the top of the order, McCullum has averaged a shade less than 32, but even that stat is inflated by the runs scored against relatively weak opposition. In the 2011 World Cup, for instance, he scored 101 against Canada, an unbeaten 76 against Zimbabwe, and 26 not out against Kenya, but only 53 runs in five innings against Australia, Pakistan, Sri Lanka and South Africa. His overall World Cup average was 42.67, but against the better bowling sides it fell to 10.60.
In fact, in 47 ODI innings against all teams except Zimbabwe and the other non-Test-playing sides in the last three years, McCullum averages only 25.46, with one century and five fifties. In the last two years against these eight teams, the numbers look even more dismal: an average of 18.62 in 24 innings, with two fifties, and a highest of 61. Those are particularly poor numbers, especially when 21 of those innings were at the top of the order, a slot which offers batsmen the best opportunity to settle in and make a significant score. During this period, he has relished playing against lesser bowling attacks, averaging 81.50 against Zimbabwe, Canada and Kenya. (A peculiar aspect of McCullum's ODI career is his record against Bangladesh. Most batsmen count Bangladesh's attack as one of the lesser ones in international cricket, but for McCullum it has been a daunting one: in 15 innings against them he averages 22.07, with only two fifties.)
| Period | All ODIs | Average | Strike rate | 100s/ 50s | ODIs v 8 teams* | Average | Strike rate | 100s/ 50s |
| Jan 2002 to Dec 2003 | 37 | 16.21 | 58.74 | 0/ 1 | 35 | 16.21 | 58.74 | 0/ 1 |
| Jan 2004 to Dec 2008 | 102 | 32.81 | 98.99 | 1/ 12 | 94 | 29.96 | 94.38 | 0/ 10 |
| Jan 2009 onwards | 59 | 31.81 | 89.25 | 3/ 7 | 50 | 25.46 | 85.13 | 1/ 5 |
| Career | 198 | 29.81 | 89.85 | 4/ 20 | 179 | 26.02 | 85.63 | 1/ 16 |
| Versus | Period | ODIs | Runs | Average | Strike rate | 100/ 50s |
| Zim + other NTP* teams | From Jan 2009 | 9 | 489 | 81.50 | 101.24 | 2/ 2 |
| Others | From Jan 2009 | 50 | 1197 | 25.46 | 85.13 | 1/ 5 |
As mentioned earlier, McCullum has opened the batting in most of the ODIs over the last three years - 43 out of 47 innings against these eight teams - which makes his record even poorer. Among openers who've scored at least 1000 runs since 2009 against teams excluding Zimbabwe and the other non-Test-playing sides, McCullum's average of 25.65 is easily the worst. The next-poorest is Mohammad Hafeez's 33.25, while the top ones like Alastair Cook, Hashim Amla and Sachin Tendulkar have averages that are more than twice that of McCullum. The strike rate is usually McCullum's stronger suit, but even there he doesn't fare very well - the top eight in the list above all have scoring rates that are better than his.
His career summary as opener during this period reveals uniformly mediocre numbers: an average of 22.80 in Australia, 18 in Bangladesh, 17.20 in India, and 24.40 at home.
| Batsman | ODIs | Runs | Average | Strike rate | 100s/ 50s |
| Alastair Cook | 22 | 1079 | 53.95 | 91.51 | 3/ 8 |
| Hashim Amla | 38 | 1882 | 53.77 | 90.00 | 5/ 14 |
| Sachin Tendulkar | 37 | 1714 | 51.93 | 94.43 | 6/ 5 |
| Gautam Gambhir | 35 | 1434 | 49.44 | 93.05 | 3/ 9 |
| Shane Watson | 59 | 2563 | 49.28 | 93.23 | 5/ 15 |
| Virender Sehwag | 45 | 1887 | 44.92 | 123.41 | 6/ 4 |
| Andrew Strauss | 46 | 1783 | 39.62 | 85.76 | 4/ 11 |
| Tillakaratne Dilshan | 69 | 2612 | 38.98 | 90.88 | 7/ 9 |
| Graeme Smith | 37 | 1278 | 35.50 | 78.79 | 2/ 7 |
| Upul Tharanga | 55 | 1780 | 34.90 | 74.69 | 5/ 10 |
| Brad Haddin | 40 | 1297 | 34.13 | 83.30 | 2/ 8 |
| Mohammad Hafeez | 38 | 1197 | 33.25 | 76.19 | 2/ 7 |
| Brendon McCullum | 44 | 1103 | 25.65 | 84.26 | 1/ 5 |
New Zealand's batsmen aren't among the most prolific in world cricket, but even among that lot, McCullum's average is the poorest. (With a 400-run cut-off against these eight teams since the beginning of 2009, only Nathan McCullum and Kyle Mills have worse averages.) Both McCullum and Martin Guptill, his opening partner in many of these matches, have played 47 innings during this period - Guptill has 11 fifty-plus scores, McCullum has just six, while Ross Taylor has 14 such scores in 52 innings.
| Batsman | ODIs | Runs | Average | Strike rate | 100s/ 50s |
| James Franklin | 21 | 422 | 38.36 | 78.87 | 0/ 3 |
| Ross Taylor | 55 | 1664 | 36.17 | 77.68 | 1/ 13 |
| Jesse Ryder | 23 | 740 | 35.23 | 95.36 | 2/ 4 |
| Martin Guptill | 49 | 1430 | 33.25 | 79.35 | 1/ 10 |
| Scott Styris | 29 | 733 | 31.86 | 80.02 | 0/ 5 |
| Grant Elliott | 30 | 613 | 30.65 | 69.73 | 1/ 3 |
| Daniel Vettori | 44 | 649 | 25.96 | 89.88 | 0/ 1 |
| Brendon McCullum | 50 | 1197 | 25.46 | 85.13 | 1/ 5 |
In Tests McCullum has lifted his game during this period, averaging 40.58 against the top seven teams, with three centuries in 17 Tests, but he needs to do much more in ODIs. A strong, run-filled series against South Africa won't be a bad way to start.
Edited by Siddarth Ravindran
S Rajesh is stats editor of ESPNcricinfo. Follow him on Twitter