Life after Murali, and batting in Sri Lanka
Since Muttiah Muralitharan's retirement, overseas batsmen have found it easier in Sri Lanka, a country where openers have fared better than the rest
S Rajesh
Sep 2, 2011, 3:19 AM
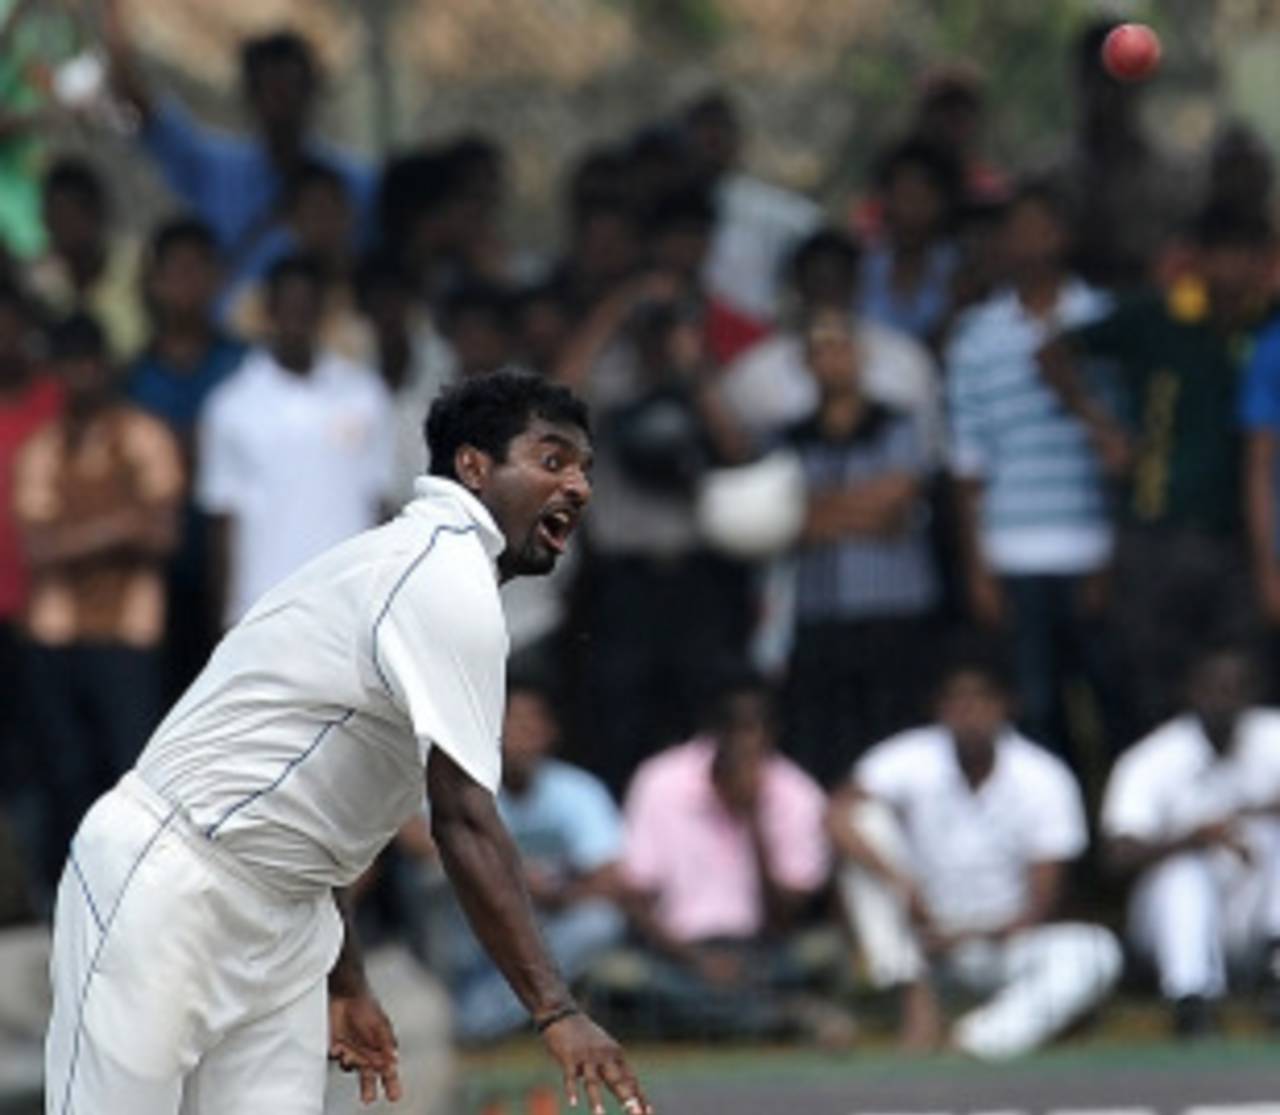
Since 2005, opposition batsmen have averaged more than 10 runs higher in Sri Lanka in Tests that Murali hasn't played in • AFP
For overseas teams, batting in Sri Lanka has surely been one of the more challenging assignments of recent years. Battling an army of spinners in conditions suited perfectly to slow bowling is an examination that several competent batsmen have failed to pass, but things just might be getting easier for them now, with Muttiah Muralitharan no longer around to torment them.
It's been a little more than a year since Murali retired, and Sri Lanka are still searching for their first Test win post Murali. They won the last Test he played, thrashing India by 10 wickets in Galle, with Murali himself taking eight to reach the 800-wicket milestone, but since then things haven't been as rosy. After managing 614 runs in two innings of that Galle Test, India scored 707 in a single innings in the second Test, and then won the third to level the series.
After that series, Sri Lanka drew a three-Test series at home against West Indies, which was admittedly seriously affected by the weather, but in the first Test the lack of bowling fire power was evident, as West Indies racked up 580 for 9 and forced Sri Lanka to follow on. Since then Sri Lanka have only played an away series in England, where they conceded more than 56 runs per wicket. Just as India have struggled without their best bowler, Zaheer Khan, so Sri Lanka have been finding it tough to dismiss opponents cheaply after Murali. In eight Tests since Murali retired (and excluding the ongoing Galle Test), Sri Lanka have lost two and drawn six, and conceded 50.39 runs per wicket.
These are still early days for Sri Lanka without Murali, though, and any team would struggle to cope with the loss of as pivotal a player. Looking at home Tests that Sri Lanka have played since the beginning of 2005, their stats with and without Murali present a huge contrast: with Murali, they've won 15 out of 20 Tests and lost only two - to Pakistan in 2006 and India in 2008. In these 20 matches, Sri Lanka's bowling average was 24.53. In the nine home Tests that he didn't play in during this period, though, Sri Lanka's bowling average went up to more than 35, and they won only two of those matches.
| Tests | W/L/D | Bowling average | Run rate | |
| With Murali | 20 | 15/2/3 | 24.53 | 3.09 |
| Without Murali | 9 | 1/2/5 | 35.03 | 3.33 |
The tables below, though, also show that the rate of scoring in Sri Lanka has gone up over the last few years. Between 2000 and 2004, the average run rate in Sri Lanka was 2.93 runs per over, with overseas teams scoring at 2.67, easily the slowest among all host countries.
However, since 2005 the run rate in Sri Lanka has gone up to 3.36, an improvement of 15%. For overseas batsmen, the improvement is about 18%, though the average runs-per-wicket figure hasn't improved much. With Murali not around, though, the average too will almost certainly go up over the next few years.
The two tables below also show the overall increase in scoring rates the world over - since 2005 the run rate in every country is greater than three, whereas in the five-year period before that, the rates were below three in four countries. West Indies, though, continues to be the most difficult place to score quickly in, which is an indication of the sluggish quality of pitches in the region.
| Host country | Tests | Average | Run rate | Hosts - ave/ RR | Visitors - Ave/ RR |
| Pakistan | 13 | 44.60 | 3.51 | 49.14/ 3.50 | 40.41/ 3.52 |
| England | 50 | 34.01 | 3.50 | 40.84/ 3.67 | 29.04/ 3.34 |
| Sri Lanka | 29 | 34.16 | 3.36 | 44.41/ 3.55 | 27.22/ 3.17 |
| Australia | 35 | 36.10 | 3.33 | 42.51/ 3.55 | 30.88/ 3.12 |
| South Africa | 34 | 31.15 | 3.30 | 35.34/ 3.38 | 27.70/ 3.22 |
| India | 31 | 39.89 | 3.29 | 44.04/ 3.50 | 36.22/ 3.10 |
| Bangladesh | 18 | 33.81 | 3.26 | 26.11/ 3.11 | 45.05/ 3.39 |
| New Zealand | 28 | 33.18 | 3.20 | 31.82/ 3.27 | 34.55/ 3.14 |
| West Indies | 30 | 34.83 | 3.13 | 31.22/ 3.07 | 38.95/ 3.19 |
| Host country | Tests | Average | Run rate | Hosts - Ave/ RR | Visitors - Ave-RR |
| Australia | 31 | 36.27 | 3.38 | 49.34/ 3.82 | 27.55/ 2.98 |
| England | 35 | 34.77 | 3.36 | 36.73/ 3.35 | 32.95/ 3.38 |
| South Africa | 25 | 34.76 | 3.26 | 44.53/ 3.41 | 28.05/ 3.11 |
| New Zealand | 19 | 31.30 | 3.11 | 32.48/ 3.08 | 30.19/ 3.13 |
| Pakistan | 19 | 33.08 | 3.08 | 35.32/ 3.09 | 31.05/ 3.07 |
| Bangladesh | 15 | 29.25 | 3.04 | 19.09/ 2.77 | 49.42/ 3.29 |
| Zimbabwe | 18 | 34.02 | 2.95 | 29.90/ 2.76 | 39.30/ 3.16 |
| Sri Lanka | 32 | 32.41 | 2.93 | 39.86/ 3.22 | 27.11/ 2.67 |
| India | 23 | 34.54 | 2.92 | 36.53/ 2.92 | 32.87/ 2.91 |
| West Indies | 29 | 32.59 | 2.84 | 32.59/ 2.91 | 32.60/ 2.78 |
Coming back to the task of batting in Sri Lanka, it's often been said that the best time to bat there for overseas batsmen is against the new ball, when run-scoring is easier and before the spinners begin their strangulating act. The numbers support this argument too: a position-wise look at the averages of overseas batsmen shows that the difference between the averages of openers and Nos. 3, 4 and 5 is more than 25%. In 110 innings, openers have scored seven centuries in 110 innings, with Virender Sehwag leading the way, scoring three in 11 innings.
The No. 3 batsmen, on the other hand, seem to have had the biggest problems, with no centuries in 55 innings. Younis Khan (247 runs in 10 innings) and Rahul Dravid (233 in 10) are among the batsmen who've struggled to make a success of the No. 3 spot in Sri Lanka. The one exception has been West Indies' Darren Bravo, who averaged 68.66 in the three-Test series in 2010.
The No. 4 batsmen have done only slightly better, with Sachin Tendulkar's 203 last year the only century in 55 innings. Among the disappointments at this spot are Younis again, Shivnarine Chanderpaul and Kevin Pietersen. The No. 5s have managed only one century too - Mohammad Yousuf's 112 in 2009.
The No. 6 batsmen, on the other hand, have done much better, with four centuries in 52 innings and an average of more than 33. VVS Laxman, Shoaib Malik, Suresh Raina and Mohammad Ashraful have all achieved three-figure scores at No. 6. In the ongoing series, Usman Khawaja has taken up that slot, and if he can add to that tally, Australia will be well served.
| Position | Innings | Runs | Average | Strike rate | 100s/ 50s |
| Openers | 110 | 3938 | 36.46 | 55.57 | 7/ 21 |
| No.3 | 55 | 1393 | 26.28 | 48.57 | 0/ 11 |
| No.4 | 55 | 1555 | 29.90 | 47.50 | 1/ 10 |
| No.5 | 53 | 1544 | 30.27 | 43.92 | 1/ 9 |
| No.6 | 52 | 1577 | 33.55 | 53.96 | 4/ 8 |
All stats updated till the end of the second day of the first Test between Sri Lanka and Australia in Galle.
S Rajesh is stats editor of Cricinfo