Hits and misses among the ICC's nominees
A look at the stats of the players who have been shortlisted for the awards, and others who could have made the cut
S Rajesh
31-Aug-2012
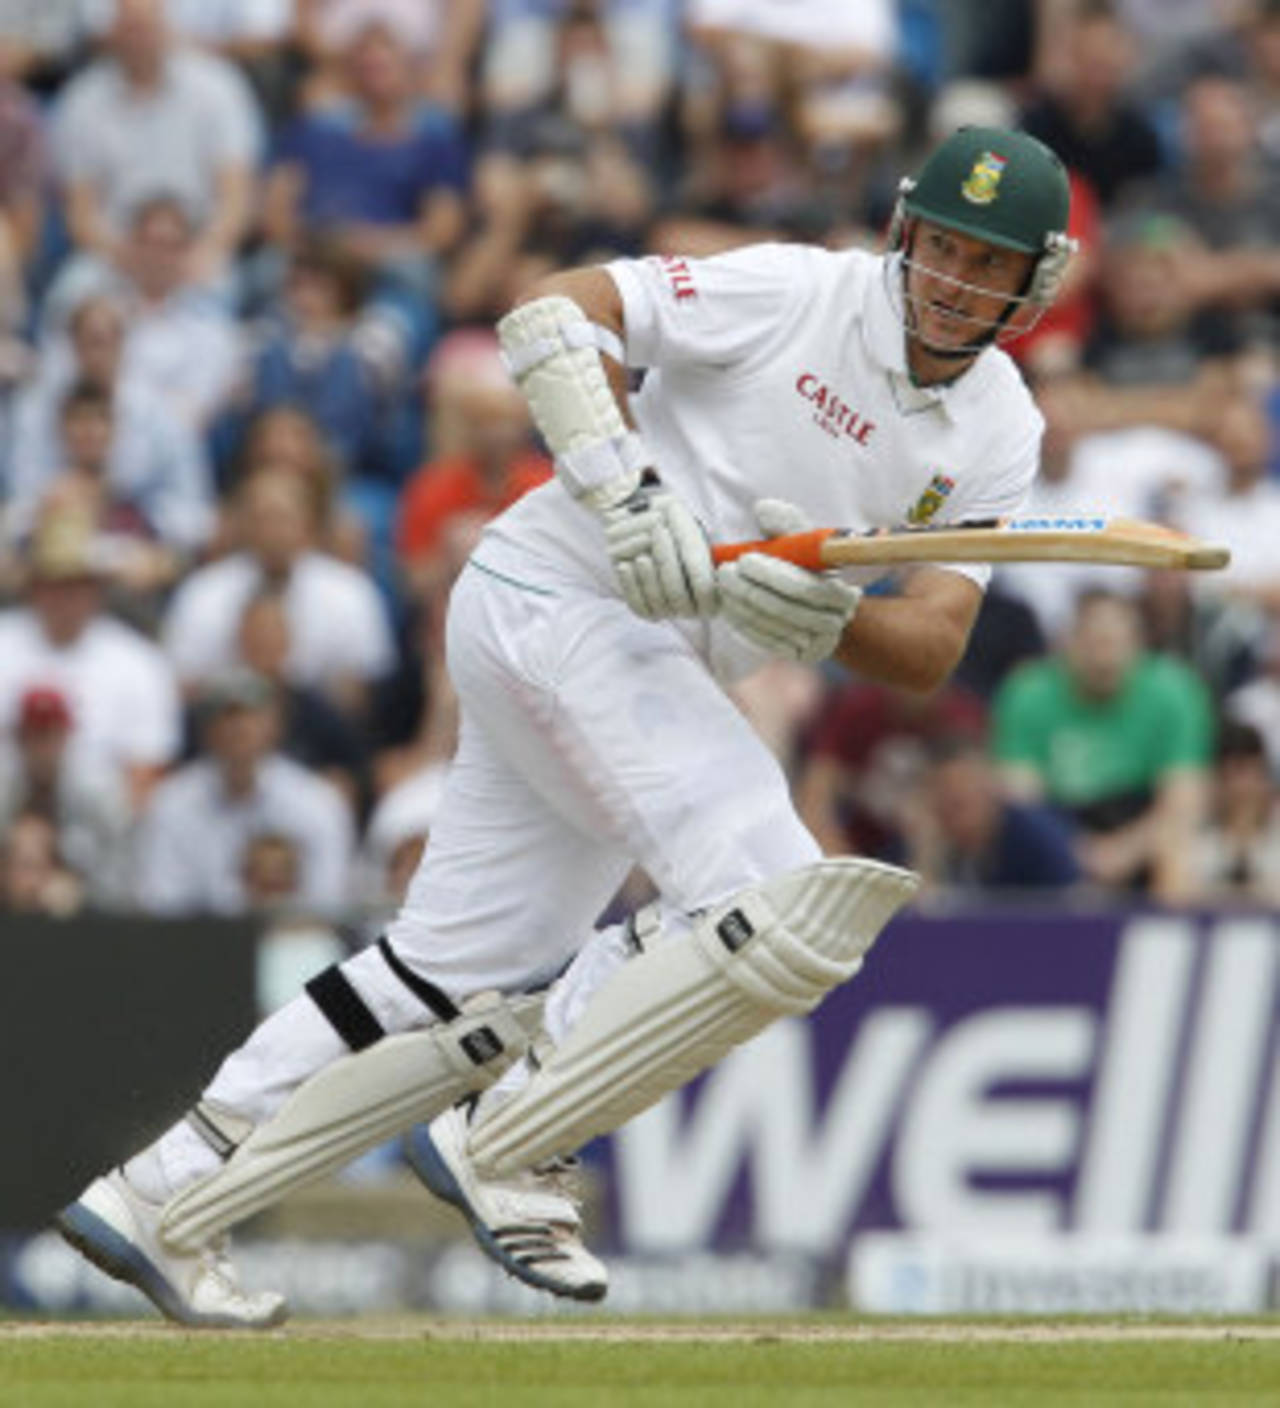
Graeme Smith isn't in the ICC's Test Team of the Year despite averaging 54.66 in the last 12 months • AFP
The shortlist is out for ICC's annual awards, with four nominees in each of the major categories, as well as a Test team of the year. Do all the players in the shortlist deserve to be there, or are there other deserving names who have missed the cut? How have the players named in the Test team fared compared to those who've missed the cut? Here's a look at the stats for batsmen and bowlers, in Tests and ODIs, between August 4, 2011, and August 6, 2012, the period that the ICC has taken into consideration for the awards. (All stats in the tables below are for performances during this period.)
Test batting
The period below has been a pretty good one for the top batsmen, with 12 batsmen scoring 750-plus runs at 50-plus averages. (The overall runs per wicket during this period was a middling 32.83, which means these success stories were compensated by other batting failures.) With the 750-run cut-off, Hashim Amla's average of 65.35 is the highest, marginally ahead of Shivnarine Chanderpaul's 65. Chanderpaul doesn't find himself in the Test Cricketer of the Year shortlist, but his performances have found him a place in the Test XI. Not only did Chanderpaul score plenty, most of his runs came against pretty good attacks too: his hundreds were scored in India and against Australia, while he made 87 not out and 91 in England.
The period below has been a pretty good one for the top batsmen, with 12 batsmen scoring 750-plus runs at 50-plus averages. (The overall runs per wicket during this period was a middling 32.83, which means these success stories were compensated by other batting failures.) With the 750-run cut-off, Hashim Amla's average of 65.35 is the highest, marginally ahead of Shivnarine Chanderpaul's 65. Chanderpaul doesn't find himself in the Test Cricketer of the Year shortlist, but his performances have found him a place in the Test XI. Not only did Chanderpaul score plenty, most of his runs came against pretty good attacks too: his hundreds were scored in India and against Australia, while he made 87 not out and 91 in England.
However, there are also strong cases in favour of Kumar Sangakkara and Michael Clarke, the two batsmen other than Amla - who's a shoo-in anyway - in the batting shortlist. Sangakkara topped the run-charts during this period with 1444 runs at 60.16, including one double-hundred and two 190s. Most of his runs came in Asia as he played 11 of his 14 Tests there, but he also managed a century in Durban in the Boxing Day Test, which led Sri Lanka to their first Test win in South Africa.
Clarke scored tough runs in Sri Lanka and South Africa, and then remorselessly pounded India's weak attack in the Australian summer, scoring a triple and double-century. His aggregate of 1355 runs was the second-highest during this period.
In the Test line-up, Amla has been pushed up to open the innings to accommodate Sangakkara, Kallis, Clarke and Chanderpaul in the middle order, but there was a strong case for Graeme Smith to take an opener's slot, even ahead of Alastair Cook. In ten Tests, Smith scored 820 runs at 54.66, with hundreds against Australia in a fourth-innings run-chase, against New Zealand and England. Cook, on the other hand, had a patchy year: he did score 1005 runs, but 294 of them came in one innings against a listless Indian attack at Edgbaston. Exclude that innings, and his average drops to 39.50. Smith's case is strong even if the comparison is purely on batting terms, excluding his contributions as captain in what was a superb year for South Africa. Mohammad Hafeez was the other opener with strong overall numbers, but two of his three Test centuries came against Zimbabwe and Bangladesh.
Kallis finds a place in a middle order on the back of 660 runs at 55, but it was a strange year for him: though he scored three hundreds, including a double, he was also dismissed without scoring four times in 14 innings. On the other hand, there were more consistent middle-order performances by AB de Villiers - who only got the 12th man's slot - Azhar Ali and Marlon Samuels. De Villiers topped 50 in seven out of 14 innings and was dismissed for less than 25 only twice, Azhar scored four centuries and five fifties in 21 innings, while Samuels had an outstanding series in England in conditions which favoured seam and swing bowling. (Kallis' bowling wasn't a huge factor either in the last year - he took nine wickets in nine Tests at 46.11.)
| Batsman | Tests | Runs | Average | 100s/ 50s |
| Hashim Amla | 10 | 915 | 65.35 | 3/ 4 |
| Shivnarine Chanderpaul | 11 | 975 | 65.00 | 2/ 6 |
| AB de Villiers | 10 | 807 | 62.07 | 1/ 6 |
| Kumar Sangakkara | 14 | 1444 | 60.16 | 5/ 5 |
| Younis Khan | 12 | 948 | 59.25 | 3/ 3 |
| Michael Clarke | 14 | 1355 | 58.91 | 5/ 2 |
| Marlon Samuels | 10 | 846 | 56.40 | 2/ 6 |
| Graeme Smith | 10 | 820 | 54.67 | 3/ 5 |
| Azhar Ali | 12 | 1028 | 54.10 | 4/ 5 |
| Mohammad Hafeez | 12 | 1064 | 53.20 | 3/ 4 |
| Alastair Cook | 12 | 1005 | 52.89 | 2/ 3 |
| Kevin Pietersen | 12 | 953 | 50.15 | 3/ 3 |
Test bowling
Vernon Philander was the obvious choice to make the cut, but Pakistan's Saeed Ajmal had a terrific year too, taking 72 wickets in 12 Tests at 24.29, including two Man-of-the-Match awards. However, he does make the ICC's Test team as the only specialist spinner, ahead of Rangana Herath and Graeme Swann (46 wickets at 31.13). There's little to argue over the fast-bowlers' slots, as Philander, Stuart Broad and Dale Steyn have clearly been the three best ones. James Anderson had a pretty good year too, but his 40 wickets came at an average of 29.02, with only one five-for in 11 Tests.
Vernon Philander was the obvious choice to make the cut, but Pakistan's Saeed Ajmal had a terrific year too, taking 72 wickets in 12 Tests at 24.29, including two Man-of-the-Match awards. However, he does make the ICC's Test team as the only specialist spinner, ahead of Rangana Herath and Graeme Swann (46 wickets at 31.13). There's little to argue over the fast-bowlers' slots, as Philander, Stuart Broad and Dale Steyn have clearly been the three best ones. James Anderson had a pretty good year too, but his 40 wickets came at an average of 29.02, with only one five-for in 11 Tests.
| Bowler | Tests | Wickets | Average | Strike rate | 5WI/ 10WM |
| Vernon Philander | 9 | 56 | 16.57 | 33.1 | 6/ 2 |
| Stuart Broad | 10 | 47 | 24.10 | 51.9 | 2/ 1 |
| Dale Steyn | 10 | 44 | 24.18 | 48.5 | 2/ 0 |
| Saeed Ajmal | 12 | 72 | 24.29 | 56.0 | 3/ 1 |
| Peter Siddle | 10 | 43 | 24.39 | 47.9 | 1/ 0 |
| Abdur Rehman | 9 | 41 | 25.02 | 59.2 | 2/ 0 |
| Rangana Herath | 13 | 70 | 25.24 | 60.5 | 6/ 1 |
| Kemar Roach | 9 | 42 | 25.59 | 44.9 | 3/ 1 |
ODI batting
The Indians had a terrible year in Test cricket, with none of them scoring 750 runs or taking 40 wickets: Rahul Dravid led the batsmen's list for India with 712 runs, while R Ashwin topped the bowlers' chart with 31 wickets. However, in ODIs, the Indians were dominant, especially in batting. Four Indian batsmen scored more than 750 ODI runs, with two of them, Virat Kohli and MS Dhoni, doing so at stunning averages and strike rates. Those two batsmen clearly deserve to be in the ICC shortlist, while Sangakkara was the second-highest run-getter in the year, with 1457 at an average of almost 43.
The Indians had a terrible year in Test cricket, with none of them scoring 750 runs or taking 40 wickets: Rahul Dravid led the batsmen's list for India with 712 runs, while R Ashwin topped the bowlers' chart with 31 wickets. However, in ODIs, the Indians were dominant, especially in batting. Four Indian batsmen scored more than 750 ODI runs, with two of them, Virat Kohli and MS Dhoni, doing so at stunning averages and strike rates. Those two batsmen clearly deserve to be in the ICC shortlist, while Sangakkara was the second-highest run-getter in the year, with 1457 at an average of almost 43.
However, there were a few other batsmen who would have been strong contenders: Clarke was consistency personified, with six 50-plus scores plus four forties in 18 innings, in which he averaged 50.60; Gautam Gambhir did well too, scoring 1004 runs at 41.83. Then there were the South Africans who don't figure in the shortlists only because they didn't play enough matches: de Villiers scored 475 runs in eight innings, and Amla 419. Both would surely have been strong contenders had South Africa played more ODIs.
| Batsman | ODIs | Runs | Average | Strike rate | 100s/ 50s |
| MS Dhoni | 25 | 859 | 78.09 | 95.23 | 0/ 8 |
| Virat Kohli | 31 | 1733 | 66.65 | 92.77 | 8/ 6 |
| Michael Clarke | 19 | 759 | 50.60 | 79.55 | 1/ 5 |
| Alastair Cook | 20 | 882 | 46.42 | 86.21 | 3/ 6 |
| Kumar Sangakkara | 37 | 1457 | 42.85 | 76.88 | 3/ 9 |
| Gautam Gambhir | 25 | 1004 | 41.83 | 84.79 | 2/ 8 |
ODI bowling
Laith Malinga was by far the leading wicket-taker during the period under consideration - and seems to have been shortlisted on that basis alone - but Malinga's overall numbers weren't particularly impressive over the last year: he took 62 wickets in 37 matches, but at an average of 27.59, and an economy rate of 5.40 runs per over. In 20 of those 37 matches, he went at five an over or more, and in three of those games his economy rate exceeded eight an over.
Laith Malinga was by far the leading wicket-taker during the period under consideration - and seems to have been shortlisted on that basis alone - but Malinga's overall numbers weren't particularly impressive over the last year: he took 62 wickets in 37 matches, but at an average of 27.59, and an economy rate of 5.40 runs per over. In 20 of those 37 matches, he went at five an over or more, and in three of those games his economy rate exceeded eight an over.
On the other hand, Sunil Narine was superb in his 15 ODIs, taking 28 wickets at 18.82 and an economy rate of 3.66 (though it can be argued that he didn't play enough to figure in the shortlist). Steven Finn was superb for England, averaging almost two wickets per match, while Ajmal also took plenty of wickets while keeping a tight control over the runs conceded.
| Bowler | ODIs | Wickets | Average | Econ rate | Strike rate |
| Sunil Narine | 15 | 28 | 18.82 | 3.66 | 30.8 |
| Steven Finn | 18 | 35 | 20.94 | 4.47 | 28.0 |
| Saeed Ajmal | 23 | 37 | 22.56 | 4.16 | 32.5 |
| Clint McKay | 17 | 27 | 23.88 | 4.52 | 31.6 |
| Shahid Afridi | 22 | 32 | 26.43 | 4.61 | 34.3 |
| Thisara Perera | 23 | 34 | 26.82 | 5.55 | 28.9 |
| Brett Lee | 20 | 31 | 27.38 | 5.23 | 31.3 |
| Lasith Malinga | 37 | 62 | 27.59 | 5.40 | 30.6 |
There were also shortlists announced for women's matches played during this period. Click on the links to check out the leading run-scorers and wicket-takers in women's ODIs, and the run-scorers and wicket-takers in women's Twenty20 internationals.
S Rajesh is stats editor of ESPNcricinfo. Follow him on Twitter