A new high for overseas spinners in India
England's spinners took 39 wickets in the four-Test series in India, which is more than what any overseas team had managed in the last 30 years
S Rajesh
Dec 21, 2012, 2:57 AM
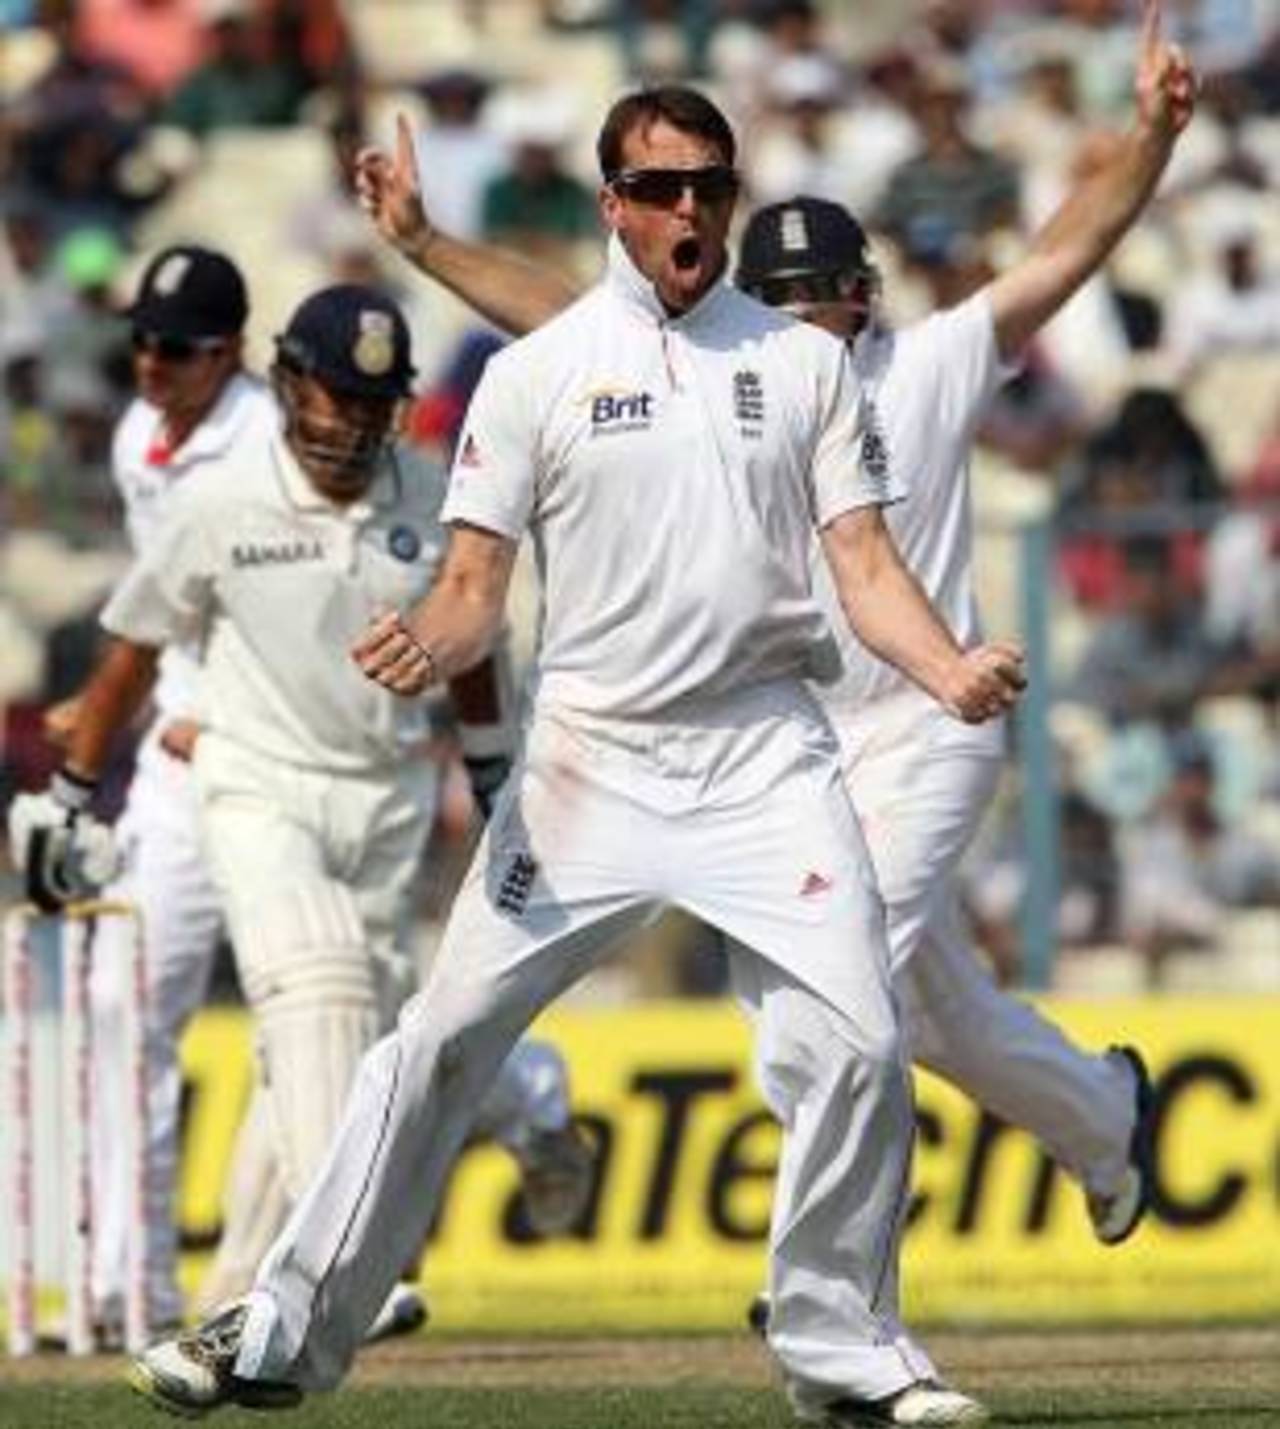
Graeme Swann has a Test average of less than 32 in every country he has played in, except Australia • BCCI
Immediately after India's series defeat against England in Nagpur, MS Dhoni said, somewhat bafflingly, that batting and pace bowling were the key differences between the two sides. Obviously they were important factors - England's batsmen were far more patient, organised and resilient than the home team's, and their pace attack, led by the skilful James Anderson, made much greater impact than India's - but the way England's spin duo bested India's slow bowlers was probably the biggest surprise of the series.
Against batsmen who were supposedly at their best against spin, Graeme Swann and Monty Panesar did huge amounts of damage - England's spinners picked up 39 wickets at 28.61, at a strike rate of 64.5 balls per wicket. Against batsmen who were supposedly iffy against slow bowling, especially in the subcontinent, India's spin contingent, led by Pragyan Ojha and R Ashwin, managed 43 at 40.62, with a strike rate of 90.5 balls per wicket. (In their previous home series, against New Zealand, the Indian spinners had taken 31 wickets in two Tests, averaging 15.93 at a strike rate of 37.8.) As far as beatings go, this was a pretty comprehensive one, and given the amount of bowling done by spinners in the series, this difference in wicket-taking ability was the decisive one in the series.
It was highly unusual too, for overseas spinners to have so much success in India. Since the beginning of 2000 and before the start of this series, overseas spinners had averaged 46.12 runs per wicket in India; the only country in which they averaged more was in Australia (49.14). During the same period, India's spinners averaged 30.49 runs per wicket at home, second only to Sri Lanka's 25.27. In 59 Tests, India's spinners took 644 wickets, more than twice the tally of the overseas ones (295).
In this series, though, the roles were reversed: Swann and Panesar churned out the kind of numbers that the Indians normally do at home, while Ojha, Ashwin and Co performed like touring spinners usually do in India.
| Host country | Tests | Hosts - wkts | Average | Strike rate | Away - wkts | Average | Strike rate |
| Sri Lanka | 67 | 690 | 25.27 | 58.9 | 345 | 43.89 | 84.2 |
| India | 59 | 644 | 30.49 | 67.0 | 295 | 46.12 | 84.8 |
| Australia | 73 | 334 | 33.43 | 65.2 | 266 | 49.14 | 84.9 |
| England | 89 | 246 | 36.00 | 71.5 | 311 | 40.32 | 76.4 |
| Pakistan | 32 | 199 | 37.38 | 76.8 | 167 | 41.85 | 81.4 |
| New Zealand | 51 | 164 | 41.40 | 89.6 | 185 | 34.35 | 74.0 |
| West Indies | 64 | 243 | 41.95 | 93.5 | 353 | 32.93 | 69.3 |
| Zimbabwe | 25 | 93 | 43.12 | 85.3 | 140 | 30.11 | 71.5 |
| South Africa | 64 | 127 | 43.40 | 84.4 | 228 | 37.41 | 72.6 |
| Bangladesh | 38 | 255 | 43.94 | 86.6 | 314 | 23.50 | 48.5 |
England's overall spin stats were among the best by any team in India ever, and certainly the finest in recent - and even not-so-recent - memory. Only three times have spinners from an overseas side taken more wickets in a series in India, and all of them were in five-Test series. It's quite conceivable that had there been another Test in this series, Swann and Panesar might have equalled or exceeded the current record.
The three instances when an overseas team took more wickets in a series with spin in India were all before 1970, which puts into perspective this effort by Swann and Panesar. Also, the others among the top eight (see table below) were all in five-Test series. The earlier record in a series of less than five Tests was 33 in three Tests by England in 1933-34, in what was India's first series at home. In the last 25 years, no overseas team had taken more than 29 spin wickets in a series in India - England exceeded that number by more than 30%. (Click here for the team-wise list of most wickets by overseas spinners in a series in India since 1970.)
| Series | Tests | Wickets | Average | Strike rate | 5WI/ 10WM |
| England in India, 1961-62 | 5 | 49 | 33.24 | 88.3 | 2/ 0 |
| England in India, 1963-64 | 5 | 48 | 39.22 | 117.1 | 2/ 0 |
| Australia in India, 1969-70 | 5 | 41 | 24.34 | 75.7 | 3/ 1 |
| Australia in India, 1959-60 | 5 | 39 | 19.69 | 66.8 | 2/ 0 |
| England in India, 2012-13 | 4 | 39 | 28.61 | 64.5 | 3/ 1 |
| England in India, 1951-52 | 5 | 38 | 31.76 | 70.8 | 2/ 0 |
| England in India, 1972-73 | 5 | 37 | 32.35 | 84.5 | 0/ 0 |
| Pakistan in India, 1986-87 | 5 | 35 | 36.85 | 82.6 | 2/ 0 |
Thanks to England's performance in this series, their overall spin stats in India are the best among all touring teams since 2000. In 12 Tests in India during this period - spread over four series - their spinners have taken 75 wickets at 35.49. Most of the good work, though, was done in this series: in eight previous matches, they'd only taken 36 wickets at 42.94, at a strike rate of 90. Those were more like the average performances by overseas spinners in India; this time, though, they turned it around completely.
Most of the other teams have struggled with their spinners. Pakistan is the only other team with a bowling of less than 40 and a healthy wickets-per-Test rate. Sri Lanka have relied on their spinners too, but they've gone for plenty of runs too. South Africa have had plenty of success in India during this period, but they've relied almost entirely on their fast bowlers.
| Team | Tests | Wickets | Average | Strike rate | 5WI/ 10WM |
| England | 12 | 75 | 35.49 | 76.8 | 4/ 1 |
| Pakistan | 6 | 42 | 37.66 | 70.1 | 2/ 0 |
| Australia | 13 | 63 | 41.26 | 69.6 | 3/ 1 |
| Sri Lanka | 6 | 48 | 45.72 | 77.3 | 2/ 0 |
| New Zealand | 7 | 38 | 48.34 | 96.5 | 1/ 0 |
| South Africa | 9 | 24 | 51.87 | 95.7 | 1/ 0 |
| West Indies | 6 | 26 | 57.34 | 102.4 | 0/ 0 |
| Zimbabwe | 4 | 18 | 61.66 | 117.0 | 1/ 0 |
These performances by Swann and Panesar have also lifted them pretty high in the all-time list of wicket-takers among overseas spinners: both have 28, which puts them in joint ninth position. Derek Underwood and Richie Benaud are on top with 54 and 52 wickets at averages of less than 27, but the two modern spin giants, Muttiah Muralitharan and Shane Warne, both average more than 43.
| Bowler | Tests | Wickets | Average | Strike rate | 5WI/ 10WM |
| Derek Underwood | 16 | 54 | 26.51 | 78.0 | 1/ 0 |
| Richie Benaud | 8 | 52 | 18.38 | 56.7 | 5/ 1 |
| Muttiah Muralitharan | 11 | 40 | 45.45 | 86.2 | 2/ 0 |
| Lance Gibbs | 9 | 39 | 23.38 | 76.0 | 3/ 0 |
| Shane Warne | 9 | 34 | 43.11 | 81.0 | 1/ 0 |
| Danish Kaneria | 6 | 31 | 39.58 | 71.1 | 2/ 0 |
| Daniel Vettori | 8 | 31 | 44.77 | 102.7 | 2/ 0 |
| Iqbal Qasim | 10 | 29 | 33.86 | 87.0 | 2/ 1 |
| Ashley Mallett | 5 | 28 | 19.10 | 64.0 | 3/ 1 |
| Graeme Swann | 6 | 28 | 28.96 | 61.3 | 1/ 0 |
| Monty Panesar | 8 | 28 | 38.25 | 81.4 | 2/ 1 |
Swann remains England's leading spinner, but Panesar's recent form should make him a certainty whenever the team opts for two spinners. Since returning to Test cricket at the beginning of this year, he has taken 33 wickets in six Tests at 26.03. He has also averaged almost 62 overs per Test, and his economy rate of 2.31 has given England plenty of control in the field.
Swann, meanwhile, continues to improve hi record in different conditions. He now has an outstanding record in Asia - 73 wickets in 13 Tests at 25.97. Breaking up those numbers country-wise, he averages 28.96 in India, 25.25 in Bangladesh, 22.18 in Sri Lanka, and 25.07 in the UAE. (Click here for his career bowling summary in Tests.) Australia is the only country in which his bowling average exceeds 32 (39.80 in five Tests). He'll surely get another opportunity to improve those numbers as well.
S Rajesh is stats editor of ESPNcricinfo. Follow him on Twitter