Too close to call
South Africa boast the better record since 2008, but Australia's dominant head-to-head performance and the hosts' recent struggles at home sets up a tight series
Madhusudhan Ramakrishnan
08-Nov-2011
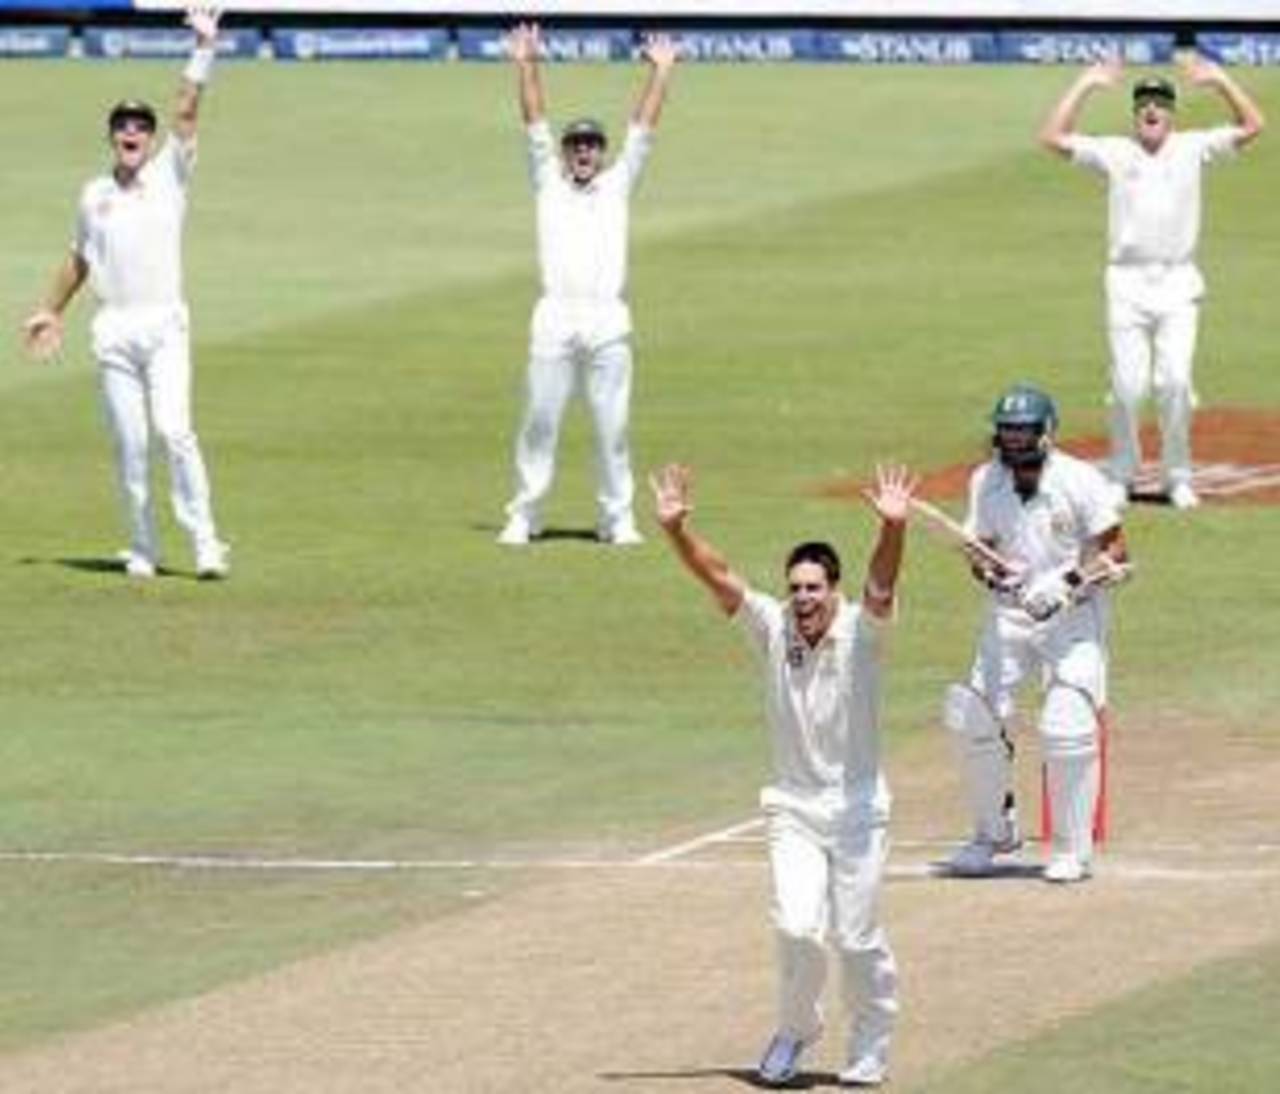
Mitchell Johnson picked up 33 wickets at 25.45 in his last six Tests against South Africa • Getty Images
Ever since their return to international cricket in 1991, South Africa have consistently been among the top Test and ODI teams. While they have been exceptionally strong in home Tests, they have maintained a very good record in away Tests too. On the flip side, however, they have never quite been able to perform well against Australia home or away. Although they won their first ever series in Australia in 2008-09, they are yet to win a home series against Australia (since readmission). Since 2005, Australia have by far been the better side in Tests played in South Africa winning five matches and losing just one. Overall, since South Africa's return, Australia have won 18 and lost just seven out of the 30 matches played between the two teams. In the same period, Australia's win-loss ratio against South Africa is 2.66 in home Tests and 2.50 away. However, after the numerous changes to the team in the last few years, Australia have been evenly matched by South Africa in home and away games. In the last two series, the teams won three matches each with the home wins for both teams coming only in the third Test after the series was lost. For the first time since their return, South Africa ended with a better average than Australia after the two three-match series in 2008-09.
| Matches | Australia (wins) | South Africa (wins) | Draws | W/L ratio | Australia (avg) | South Africa (avg) | |
| Overall | 30 | 18 | 7 | 5 | 2.57 | 37.94 | 30.11 |
| In Australia | 15 | 8 | 3 | 4 | 2.66 | 39.38 | 31.58 |
| In South Africa | 15 | 10 | 4 | 1 | 2.50 | 36.54 | 28.71 |
| In Australia (since 2005) | 6 | 3 | 2 | 1 | 1.50 | 41.04 | 38.89 |
| In South Africa (since 2005) | 6 | 5 | 1 | 0 | 5.00 | 36.66 | 29.60 |
| Previous two series | 6 | 3 | 3 | 0 | 1.00 | 36.91 | 39.19 |
Before 2008, Australia were streets ahead of the other teams. Their win-loss ratio in Tests played between 2000 and 2007 was an extraordinary 6.70, while that of the second-placed team (South Africa) was 1.57. Their average difference in the same period (17.08) was also much higher than Sri Lanka (6.29) and South Africa (6.07). However, the stats are vastly different in matches played since 2008. Australia's win-loss ratio has fallen to 1.35 while South Africa have a corresponding ratio of 2.12. Australia, who had not lost a single home series for almost 16 years since their 2-1 defeat to West Indies in 1992-93, lost two home series to South Africa and England. They were also below par in India and England winning just one game and losing five. South Africa, on the other hand, have been impressive in England and India, but have been unable to replicate the same form at home. In three home series against Australia, England and India, they have lost one and drawn two. South Africa, however, have a much better average difference (11.14) as compared to Australia (2.55) in Tests played since the beginning of 2008.
| Team | Played | Won | Lost | Drawn | W/L ratio | Bat avg | Bowl avg | Avg diff |
| Australia (overall) | 43 | 19 | 14 | 10 | 1.35 | 37.18 | 34.63 | 2.55 |
| South Africa (overall) | 33 | 17 | 8 | 8 | 2.12 | 42.69 | 31.55 | 11.14 |
| Australia (home) | 19 | 10 | 6 | 3 | 1.66 | 37.10 | 34.93 | 2.17 |
| South Africa (home) | 14 | 7 | 4 | 3 | 1.75 | 40.35 | 28.64 | 11.71 |
| Australia (away) | 24 | 9 | 8 | 7 | 1.12 | 37.24 | 34.40 | 2.84 |
| South Africa (away) | 19 | 10 | 4 | 5 | 2.50 | 44.42 | 34.04 | 10.38 |
The South African top-order batsmen have clearly been more successful than their Australian counterparts in the last three years. Four of the top five have averages over 55 in matches played since 2008. Jacques Kallis has an outstanding ratio of hundreds to fifties (11:8) while Graeme Smith and AB de Villiers are not too far behind with corresponding ratios of 10:11 and 9:10. de Villiers has also been superb against Australia averaging 75 in six Tests with three centuries. The Australian batsmen, on the other hand, have not had such a great time in the last few years. Shane Watson, who has become Australia's regular opening batsman, averages 40.81 in the same period, but has a very poor hundreds to fifties ratio (2:15). Ricky Ponting, who has struggled to convert his starts in recent times, will look to improve on his excellent Test record against South Africa. Phillip Hughes, who is back opening the innings after being out of the side for nearly two years, was Australia's leading run-getter in South Africa with 469 runs in the three Tests.
By virtue of the consistent performances of the top-order batsmen, South Africa have better partnership stats for the top three wickets. Australia's middle-order partnership stats, however, are boosted by the excellent performances of Michael Hussey and Michael Clarke. Mitchell Johnson, Australia's best bowler against South Africa in recent contests, also adds weight to the lower-order batting. Johnson was in excellent batting form in the previous series in South Africa scoring an unbeaten 96 in the first Test and his first century in the third.
| Partnership wicket | Australia (average) | Australia (100/50 stands) | South Africa (average) | South Africa (100/50 stands) |
| 1 | 49.00 | 9/22 | 52.82 | 7/19 |
| 2 | 42.18 | 10/11 | 59.94 | 9/16 |
| 3 | 41.00 | 7/19 | 50.09 | 7/10 |
| 4 | 47.07 | 9/16 | 45.40 | 8/7 |
| 5 | 38.50 | 7/12 | 47.86 | 6/7 |
| 6 | 51.95 | 7/24 | 51.19 | 7/9 |
In Dale Steyn, South Africa have perhaps the best fast bowler in world cricket. Steyn has been brilliant since his debut and has the best strike rate among all Test bowlers with over 200 wickets. In the last two series against Australia, Steyn was the leading wicket-taker with 34 wickets. Morne Morkel, Steyn's opening bowling partner, proved dangerous in the home series against India in conditions which offered bounce and movement. Johnson, who has had an ordinary time in Tests over the last two years, will howeve, love to get back to playing South Africa. He picked up 33 wickets in the six Tests in 2008-09 and bowled a hostile spell in Durban injuring both Smith and Kallis. Ryan Harris, who has had a terrific start to his Test career with 31 wickets in seven Tests at an average of just 20.90, is likely to partner Johnson. However, on a wicket in Cape Town that is likely to assist spinners, there is a possibility that South Africa might field both Paul Harris and Imran Tahir while Nathan Lyon, who picked up a five-wicket haul in an impressive debut in Galle, will provide the variety in Australia's attack.
| Bowler | Team | Matches | Wickets | Average | 5WI/10WM |
| Mitchell Johnson | Australia | 42 | 176 | 30.70 | 7/2 |
| Peter Siddle | Australia | 23 | 78 | 31.62 | 4/0 |
| Ryan Harris | Australia | 7 | 31 | 20.90 | 2/0 |
| Shane Watson | Australia | 27 | 48 | 28.58 | 2/0 |
| Dale Steyn | South Africa | 30 | 162 | 22.26 | 10/2 |
| Morne Morkel | South Africa | 30 | 110 | 30.03 | 4/0 |
| Paul Harris | South Africa | 28 | 74 | 43.36 | 2/0 |
Since their readmission, South Africa have won 14 matches in Cape Town, the most at any home venue. Their record at the Wanderers is less flattering with nine wins and seven losses. In matches since 2000, the win-loss record in Johannesburg is an even 5-5 whereas the corresponding number in Cape Town is 9-2. Teams batting first have clearly struggled in Cape Town winning just two games and losing nine. The first-innings average in Cape Town is lower than the average in Johannesburg but the average across the other three match innings at the Wanderers has been much lower. In matches played since 2000, pace bowlers average 27.61 in Johannesburg, but slightly higher in Cape Town (33.22). Cape Town, however, has been the better venue for spinners (114 wickets at 40.29) as compared to Johannesburg (35 wickets at 41.97).
| Venue | Matches | Result % | Wins/losses (batting first) | 1st inns (avg) | 2nd inns (avg) | 3rd inns (avg) | 4th inns (avg) | Pace (wickets, avg) | Spin(wickets,avg) |
| Cape Town | 15 | 74 | 2/9 | 32.50 | 39.10 | 30.55 | 43.00 | 333, 33.22 | 114, 40.29 |
| Johannesburg | 11 | 90 | 6/4 | 33.89 | 29.65 | 27.22 | 26.82 | 311, 27.61 | 35, 41.97 |