Top bowling and batting performances in the World Cup
A look at the best bowling and batting innings of the World Cups using two elaborate methods - Innings Spell Value and High Score Index. Plus, the Bradman memorabilia
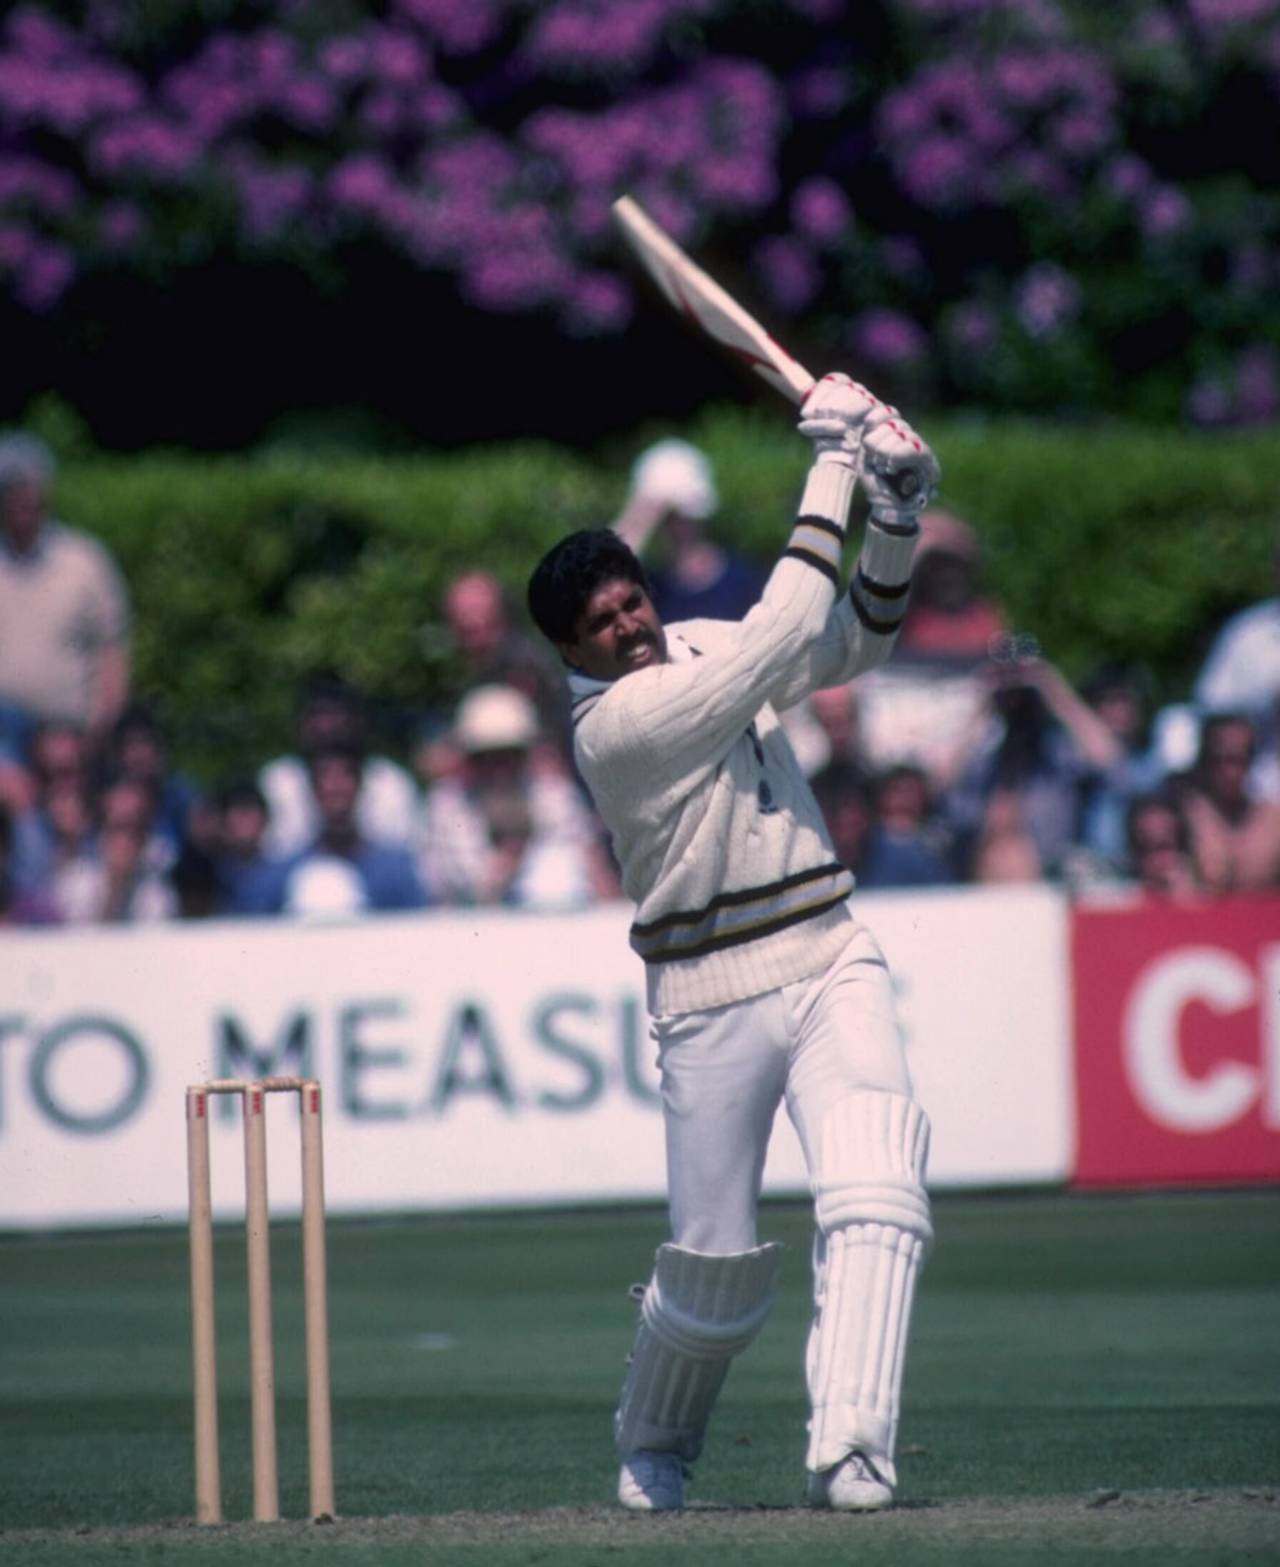
Kapil Dev's 138-ball 175 against Zimbabwe in 1983 is the best innings of the World Cup based on HSI value • Getty Images
High Score Index (HSI) is a measure to determine the top batting performances. An article on this was published a few months back. That article covered all ODIs. Now I will look at the World Cup batting performances from the HSI point of view. I have also strengthened the HSI with strike-rate values, which are very relevant in ODI innings. In addition I will introduce a new concept to measure the top bowling performances, called ISV (InnSpell Value).
Let me first explain ISV since it's is a new measure.
What are the main objectives of an ODI bowler? He has to take wickets. If the wickets are those of top-order batsmen, that's great. If he can dismiss top-order batsmen for low scores, that's wonderful. Finally, he has to bowl economically, both in an absolute manner and in the context of the innings. The ISV is a composite of these sub-measures. Without using context, these sub-measures define, almost completely, how well he has bowled. Let us see how it is determined.
I credit the bowler with the RpI of the batsman he dismissed. This is the base value, irrespective of when the batsman was dismissed. Whether AB de Villiers is dismissed in the fifth over or the 47th, the bowler has done his team a huge favour. Now I come to the second and variable part of the wicket. If de Villiers is dismissed for 5, the bowler has done a great favour to his team. If he dismisses him at 145, nothing.
So this variable component is applicable only when the batsman is dismissed at a score below his RpI and is the difference between the batsman's score and RpI. If a bowler dismisses de Villiers for 9, he gets 78.72 points (43.36+34.36) where 34.36 is arrived at by subtracting 9 from 43.36 (43.36-9 = 34.36). If a bowler dismisses de Villiers for 37, he gets 49.72 points [43.36+6.36 (43.36-37)]. If a bowler dismisses de Villiers for 87, he only gets 43.36 points. The second part of this calculation is applicable only if the RpI of the batsman is greater than 20. Logical, since I do not want to give the bowler a credit of 1.45 when he dismisses James Anderson for 2 or 2.06 for dismissing Ashish Nehra at 1!
Now we come to the bowling accuracy. This is done in two stages. Let us say that a bowler has an innspell of 10-1-43-2. The RpO, 4.3, is an absolute value and the bowler is credited with certain number of points. However, if this bowling spell is part of an innings in which the rest of the team bowled at 5.43 then he gets substantial additional credit. On the other hand, if this bowling spell is part of an innings in which the rest of the team bowled at 2.72, he gets very little additional credit. In other words, some context, whatever can be derived from the scorecard, is used.
These points are normalised to reflect the actual performance. The ISV values are pegged at a slightly higher level than HSI and an ISV value greater than 2.0 reflects a good bowling spell. The average ISV is higher than the average HSI value since there are far fewer bowling spells. This does not matter since these are derived from two totally different processes. These are apples and burgers and cannot really be compared.
Let us now look at the top World Cup innings by ISV.
| . | ||||||||
| ODI# | Year | Inns | Result | Bowler | For | Vs | Analysis | ISV |
|---|---|---|---|---|---|---|---|---|
| . | ||||||||
| 0031 | 1975 | 1 | W | GJ Gilmour | Australia | Eng | 12.0 - 6 - 14 - 6 | 5.177 |
| 1976 | 2003 | 1 | W | AJ Bichel | Australia | Eng | 10.0 - 0 - 20 - 7 | 4.909 |
| 1986 | 2003 | 1 | SE Bond | New Zealand | Aus | 10.0 - 2 - 23 - 6 | 4.831 | |
| 0748 | 1992 | 2 | W | EA Brandes | Zimbabwe | Eng | 10.0 - 4 - 21 - 4 | 4.739 |
| 0730 | 1992 | 2 | W | MW Pringle | South Africa | Win | 8.0 - 4 - 11 - 4 | 4.646 |
| 1976 | 2003 | 2 | AR Caddick | England | Aus | 9.0 - 2 - 35 - 4 | 4.324 | |
| 3147 | 2011 | 1 | Wahab Riaz | Pakistan | Ind | 10.0 - 0 - 46 - 5 | 4.168 | |
| 3120 | 2011 | 1 | RJ Peterson | South Africa | Eng | 8.0 - 2 - 22 - 3 | 4.157 | |
| 1969 | 2003 | 2 | W | A Nehra | India | Eng | 10.0 - 2 - 23 - 6 | 4.149 |
| 1962 | 2003 | 2 | W | JM Anderson | England | Pak | 10.0 - 2 - 29 - 4 | 4.143 |
| 1970 | 2003 | 2 | W | GD McGrath | Australia | Nam | 7.0 - 4 - 15 - 7 | 4.129 |
| 1473 | 1999 | 2 | W | GD McGrath | Australia | Ind | 10.0 - 1 - 34 - 3 | 4.100 |
| 1951 | 2003 | 1 | W | JN Gillespie | Australia | Ind | 10.0 - 2 - 13 - 3 | 4.100 |
| 1965 | 2003 | 2 | W | CO Obuya | Kenya | Slk | 10.0 - 0 - 24 - 5 | 4.099 |
| 1483 | 1999 | 2 | SK Warne | Australia | Saf | 10.0 - 4 - 29 - 4 | 4.097 | |
| 1468 | 1999 | 2 | W | NC Johnson | Zimbabwe | Saf | 8.0 - 1 - 27 - 3 | 4.082 |
| 1973 | 2003 | 2 | W | WPUJC Vaas | Sri Lanka | Win | 10.0 - 3 - 22 - 4 | 4.050 |
| 0202 | 1983 | 2 | W | RJ Hadlee | New Zealand | Pak | 9.0 - 2 - 20 - 3 | 4.014 |
| 3105 | 2011 | 2 | W | Shahid Afridi | Pakistan | Ken | 8.0 - 3 - 16 - 5 | 4.007 |
| 1470 | 1999 | 1 | W | GD McGrath | Australia | Win | 8.4 - 3 - 14 - 5 | 3.968 |
Gary Gilmour dismissed the top six batsmen for 2, 6, 8, 7, 4 and 0. He had an economy rate of 1.167. What more do we want? His ISV is 5.177, the only bowling performance above 5.0, which is almost the maximum any bowling performance could reach.
Andy Bichel removed five top-order batsmen for 30, 2, 1, 46, 10 and 45. So he did not score too heavily on the wicket-quality front. But where he scored was that the rest of the team bowled at an RpO of 4.5 while his RpO was 2.0. Hence he comes quite close to Gilmour. And the additional seventh wicket also helps.
Shane Bond dismissed the top four Australian batsmen for 18, 1, 6 and 31. He bowled at 2.3 as compared to his team's 5.0. So his ISV is an excellent 4.831. It is another thing that New Zealand lost the match. That result, however, does not affect Bond's high ISV.
Now we come to an outstanding performance by a bowler from a team of so-called minnows. Eddo Brandes dismissed Graham Gooch for 0, Allan Lamb for 17, Robin Smith for 2 and Graeme Hick for 0. So his ISV is a very high 4.739 even though he captured only four wickets. This also highlights the true value of the ISV measure.
To round off the top five, we have an excellent performance by Meyrick Pringle of South Africa. He dismissed Brian Lara for 9, Richie Richardson for 1, Carl Hooper on 0 and Keith Arthurton on 0. An excellent economy rate meant that his ISV is a very high 4.646. Arthurton's low RpI value pulls this performance down slightly.
Among the other performances, Wahab Riaz's excellent bowling spell against India in the 2011 World Cup deserves a mention. Similarly Nehra's top-class bowling effort against England in 2003 is a notable one. Can anyone ever forget Shane Warne's effort against South Africa in the 1999 semi final? Or Robin Peterson's one-man demolition of England in 2011: he dismissed Andrew Strauss for 0, Kevin Pietersen for 2 and Ian Bell for 5. It can be seen that many of these matches, including the last one, were lost by these teams.
Glenn McGrath appears three times in this table of top 20 World Cup performances. No one else even appears twice.
Just to recap HSI, which is determined by the following formula, given for the top scorer.
HSI = (BatsmanScore / NextHighestScore) * (BatsmanScore / TeamScore) * StrikeRateIndex.
The Strike Rate Index is a composite value between 1.0 and 2.0 derived from the batsman's absolute strike rate and relative factor derived by comparing the strike rates of the batsman and the team. This factor adds significant weight to the quality of the HSI measure.
For the scores other than the highest scores a simple formula is used: HSI = (BatsmanScore / TeamScore) * StrikeRateIndex.
| . | |||||||||
| ODI# | Year | Inns | Result | Batsman | For | Vs | Runs | Balls | HSI |
|---|---|---|---|---|---|---|---|---|---|
| . | |||||||||
| 0216 | 1983 | 1 | W | N Kapil Dev | India | Zim | 175* | 138 | 7.975 |
| 1963 | 2003 | 1 | JM Davison | Canada | Win | 111 | 76 | 5.549 | |
| 1944 | 2003 | 2 | SB Styris | New Zealand | Slk | 141 | 125 | 4.435 | |
| 0747 | 1992 | 2 | W | Rameez Raja | Pakistan | Nzl | 119* | 155 | 4.054 |
| 2539 | 2007 | 2 | W | NJ O'Brien | Ireland | Pak | 72 | 107 | 3.777 |
| 2581 | 2007 | 1 | W | AC Gilchrist | Australia | Slk | 149 | 104 | 3.439 |
| 2535 | 2007 | 1 | JP Bray | Ireland | Zim | 115* | 137 | 3.124 | |
| 0749 | 1992 | 2 | BC Lara | West Indies | Aus | 70 | 97 | 3.123 | |
| 2547 | 2007 | 1 | W | Imran Nazir | Pakistan | Zim | 160 | 121 | 3.098 |
| 1955 | 2003 | 1 | HH Gibbs | South Africa | Nzl | 143 | 141 | 3.037 | |
| 2553 | 2007 | 1 | SO Tikolo | Kenya | Eng | 76 | 97 | 3.036 | |
| 2542 | 2007 | 2 | DL Hemp | Bermuda | Ind | 76* | 105 | 2.953 | |
| 1982 | 2003 | 2 | PA de Silva | Sri Lanka | Aus | 92 | 94 | 2.915 | |
| 1049 | 1996 | 1 | W | G Kirsten | South Africa | Uae | 188* | 159 | 2.887 |
| 2555 | 2007 | 1 | W | ML Hayden | Australia | Win | 158 | 143 | 2.886 |
| 0197 | 1983 | 2 | MD Crowe | New Zealand | Eng | 97 | 118 | 2.861 | |
| 0061 | 1979 | 1 | GR Viswanath | India | Win | 75 | 134 | 2.801 | |
| 0217 | 1983 | 2 | W | G Fowler | England | Slk | 81* | 77 | 2.742 |
| 1453 | 1999 | 2 | GM Hamilton | Scotland | Pak | 76 | 111 | 2.681 |
This Kapil Dev innings is well-known. Kapil came in at 9 for 4, saw the score slide to 17 for 5, and scored an unbeaten 175 to take India to 266 for 8 and on to a 31-run win. The next-highest score was 24 by Syed Kirmani. Kapil's innings was scored at good rate. Very few innings in ODIs have a higher HSI value.
At second place is a relatively unknown innings by John Davison, playing for Canada. Not one supporting batsman reached 20. And his hundred was made at breakneck pace.
In 2003, in response to 272 by Sri Lanka, New Zealand slumped to 15 for 3. Then Scott Styris played one of the all-time great ODI innings. He scored 141 out of the team total of 225, in only 125 balls. The next-best innings was by Chris Cairns, with 32.
Since Pakistan scored 167 for 3 in response to New Zealand's 166, Ramiz Raja's 119 in Christchurch in the 1992 World Cup probably does not deserve a place. But these are numbers and cannot be ignored. The next best was 30 and the 119 was out of 167. In fifth place is Niall O'Brien's classic innings of 72 out of 133 for 7, which was a winning total against Pakistan in 2007. The next-best innings was 16.
Adam Gilchrist's masterpiece of 149 in the 2007 final has a high HSI because the next-best score was 38 and this innings was out of Australia total of 281. The strike rate was above 1.5. There are quite a few not-so-well-known batsmen, like Jeremy Bray, David Hemp and Scotland's Gavin Hamilton featuring in the top 20.
One feature of the top 20 table is that no fewer than 12 innings have been played in a losing cause.
In my next pre-World Cup piece I will be looking at team performances. Using the contribution values, I will look at how teams have performed across World Cups and in specific World Cups. During this World Cup, all three types of analyses will be done and presented at appropriate intervals.
Bradman memorabilia
A lovely gift, as beautiful as anything Sri Lankan, given to Don Bradman when the Australians stopped in Colombo halfway through their long journey from Fremantle to Southampton. Bradman left Bowral on March 6 and arrived in London on April 23. Those were the days. The Australian team stopped in Colombo for a couple of days and played a one-innings game against Ceylon. To view this, please click HERE.
Anantha Narayanan has written for ESPNcricinfo and CastrolCricket and worked with a number of companies on their cricket performance ratings-related systems