Anantha Narayanan
An analysis of the biggest ODI wins batting first and chasing
First, something of interest to the readers. In one of my responses I had mentioned that I had just finished reading Lynne Truss's classic "Eats, shoots and leaves" and hoped that my apostrophes were correctly placed. This was like a fleeting peep into the unknown. Couple of readers mailed and asked me about the book. A nice diversion for me, I thought. Here we go.
Lynne Truss's book is an all-time classic on English punctuation and should be read by anyone who does anything in English. It is now availeble in a low-cost edition in India. Okay, what about the title.
A panda walks into a cafe. He orders a sandwich, eats it, then draws a gun and fires shots in the air. He then walks towards the exit.
The waiter is baffled and asks the panda "why ?". The panda produces a wildlife manual and asks the waiter to read the desription of himself, the panda.
Sure enough, there is an explanation.
"Panda: Large black-and-white bear-like animal, native to China. Eats, shoots and leaves."
The waiter understands.
To those of you who have not got it, the single comma, inserted unnecessarily between eats and shoots, changes the whole sentence on the panda's eating habits. It should have been "Eats shoots and leaves.", "shoots", of course, referring to bamboo shoots. No wonder, he protested.
Do not miss this classic on correct punctuation. It is a constant bed-side companion book for me.
At the beginning of last year I had looked at huge ODI wins, using scoring rates as the base. This represented the relative usage of resources in an indirect manner. In this article I have looked at wins achieved with least deployment of resources looking at the same directly.
Let us first look at the chasing wins which offer the clearest look at deployment of resources. Everything is cut and dried at the beginning of the chasing innings and we would be able to determine the availability of resources in a very accurate manner.
Let me say that a team is restricted to 99 in the first innings, it does not matter whether they were dismissed in the 31st over or scored 99 for 8 (as Bangladesh did way back) in 45 overs. The target in front of the chasing team is 100. They have two resources at their disposal, viz., 10 wickets and x balls (normally 300). This is fixed and set in stone, ignoring the matches where rains come in and the duo of dons from England take over. In most cases the resource situation remain clear.
In the first part of this article I am going to look at the wins in which the winning teams expended the minimum of these resources and won by a few miles, so to speak.
First, the balls available. There may be Power play options, fielding restrictions in force, ball changes et al. However it is safe to conclude that the balls resource can be measured in a linear manner. With the advent of two optional Power Plays, no one can say that the middle overs are low-scoring overs. The batting team can take the PP at any time to compensate for a low-scoring period, although the captains rarely do so. Hence I will take the balls resource in a linear manner. If the maximum balls is 300 and 210 balls are available, 30% of this resource has been used. If 120 balls are available, 60% has been used and so on.
The wickets resource is slightly tricky. Not all wickets are equal. Certainly the top order wickets are more valuable than the low order wickets. There are two ways of doing this. The first is a simpler but very good method. I assign the following weights for the wickets. Not subjectively done, but by an informed allocation.
Wickets 1 to 6: 12.5% - 75%
Wicket  7:      10.0% - 85%
Wicket  8:       7.5% - 92.5%
Wicket  9:       5.0% - 97.5%
Wicket 10:       2.5% - 100%
If 4 wickets are lost, 50% of wicket resource has been used, if 7 wickets are lost, 85% of the wicket resource has been used and so on. It works very well. The only point of contention might be the argument that at the fall of 6th wicket we might still have a pair of very good batsman batting. But the weight is a fair 10% for the seventh wicket and Gilchrists and Dhonis, batting at 7, do not abound in plenty.
The second is to do a more accurate weighting of wicket values. I add the ODI Index (Batting average x Strike rate) values for all 11 batsmen. This represents the total available resource. I then determine the sum of ODI Index for the dismissed batsmen. This represents the already deployed resource. The ratio between the two gives us the required value. If Tendulkar and Vijay open, and one of them is out in a 9-wkt win, the resource available will vary significantly depending on which one is out. Of course for 10-wkt wins, the two methods lead to the same result.
I have done the calculations on both methods. My personal take is that the simpler method is sufficient and works well in 95% of the situations. The two resources carry equal weights. There might be situations where one might be more valuable than the other. Bot there is no clear way in which this sort of variable weight can be determined.
Let us now look at the tables. First, the one based on a simple wicket weight.
Wicket resource calculation: Method 2 - Simple wkt weight based
A look at few of the classic third innings batting performances over the years
After four or five fairly heavy analytical articles, I feel it is time I did an anecdotal post, this time from the heart. My Resident editor would also be quite happy since he has been pushing me for such articles once in a while. Sitting in cold Minneapolis, this would make Sriram's day.
The first innings of a test match is a completely open-ended one. What should one aim at. What is a good score. Should one consume time or attack more. Is 225 for 1 at close of play on the first day better than 300 for 4 or vice versa. No one can forecast with any degree of certainty the answers to these questions.
The second innings at least is more defined. There are some targets to aim at. If the opponents score 500 or thereabouts, the first target is to avoid follow-on. If the score in front is around 350, the normal target is to overhaul it. If the first batting has scored 200, the second batting team has to be wary of a difficult pitch but, in general, looks for a substantial lead.
The fourth innings is the purest one. Whatever the team started with is the winning target. It could be 1 or 836 (both are actual targets in test matches). This number is clearly available to both teams. While time/overs/weather are factors, this target never changes. In my earlier article I had looked at epochal fourth innings.
The third innings is the most fascinating one of all. If a team has followed on or trails by a substantial deficit, the first target is to clear the deficit and then build on setting a reasonable target. If the two first innings are comparable, then a substantial target score has to be aimed at. If the team is batting with a substantial lead, then it is only a question of timing the declaration, leaving enough time to win. However the third innings is the one where serious strategizing starts. The seeds of the result aimed for are sown here.
One constant factor which is present in most of these winning third innings knocks is that these do not lead to wins by themselves. It still requires great bowling efforts, such as that of Willis, Harbhajan, Trott and Hauritz et al to complete the winning process.
In this article I have looked at a baker's dozen of epochal performances in third innings. Before the reader sharpens his keyboard skills to shoot off a comment, note the adjective used, "epochal", not "greatest". These are my selections, mostly using objective analysis such as Wisden-100 tables, but also incorporating some from the lower reaches of the table, innings which were truly great.
Let me mention that most of the the top 10 from the third innings performances from the Wisden-100 table find their place here. The Wisden-100 itself is heavy with great third innings performances, with 4 of the top-6 coming in the third innings. There are 10 winning performances, 2 from drawn matches and 1 from lost matches. There is a fair distribution across ages and teams. If I have missed out a team, it is only because I am trying to push in a litre of liquid in a pint bottle.
As I have already said, this is my selection, 75% objective and 25% subjective. Readers will have their own favourite fourth innings and are welcome to send in their comments referring to these innings. The only requirement is that you have to take the trouble of looking up the concerned scorecard and give some details. Rather than posting comments such as "What about Inzamam's 95", the comments which are likely to get published are the ones where a better insight into the concerned innings are provided. Do not get upset that one specific performance is not in this list or in the nearly-made-it list. Put up your cases in a nice and emphatic manner.
Let us look the performances. These are published in no particular order so that no one says why is this in first position or not in first position.
1. MtId: 1171 (1991) 1 of 5 (Eng: 0-0) England won by 115 runs
Eng 198 all out.
Win 173 all out.
Eng 252 all out (Gooch G.A: 154*).
Win 162 all out.
After two sub-200 innings, England started 25 runs ahead. Then Gooch, an under-rated batsmen if ever there was one, played one of the greatest innings ever against a bowling attack of Ambrose, Patterson, Marshall and Walsh. He scored 154 out of 252. There were two other innings of 27 and nothing else. Look at the % of score, 61.1%. To boot, he remained unbeaten. He added 98 for the seventh wicket with Pringle. England won by 115 runs. I think this innings stands comparison with any of the modern classics.
2. MtId: 1535 (2001) 2 of 3 (Ind: 0-1) India won by 171 runs
Aus 445 all out.
Ind 171 all out.
Ind 657 for 7 wkts (Laxman V.V.S: 281).
Aus 212 all out.
What does one write about this innings. Half the cricket followers would anoint this classic as the best Test innings ever and they would not be far away from truth. The support of Dravid was as important as Harbhajan's bowling on the last day to effect this amazing win. In many ways this innings and win was the watershed in the Indian cricket teams' attitude and start of a new phase of self-belief.
3. MtId: 0257 (1937) 3 of 5 (Aus: 0-2) Australia won by 365 runs
Aus 200 for 9 wkts.
Eng  76 for 9 wkts.
Aus 564 all out (Bradman D.G: 270).
Eng 323 all out.
The first two days were played on gluepot pitches. England declared 124 behind in a bid to cash in on the treacherous nature of the pitch. Bradman countered by sending in his late order batsmen and Australia were 97 for 5. Then Bradman and Fingleton got together and added 346 runs. After that everything was downhill. Australia won by a massive margin of 365 runs. As much a tribute to Bradman's strategic skills as to his batting. It should not be forgotten that Australia were trailing 0-2 with 3 to play. Starting with this test, they won the next three tests and won the series 3-2. The only time this has happened in history of Test cricket, as mentioned in my last article.
4. MtId: 1716 (2004) 1 of 2 (Pak: 0-0) Sri Lanka won by 201 runs
Slk 243 all out.
Pak 264 all out.
Slk 438 all out (Jayasuriya S.T: 253).
Pak 216 all out.
A recent masterpiece. After two middling innings, Sri Lanka were behind by 21 runs. Jayasuriya anchored the innings with an outstanding effort of 253 in 348 balls. He was ably supported by two fifties from Sangakkara and Jayawardene. Jayasuriya's high innings was still nearly 60% of Sri Lankan score. Sri Lanka then won comfortably despite being without Muralitharan. It must be mentioned that this was at the feather-bed in Faisalabad.
5. MtId: 0905 (1981) 3 of 6 (Eng: 0-1) England won by 18 runs
Aus 401 for 9 wkts.
Eng 174 all out.
Eng 356 all out (Botham I.T: 149*).
Aus 111 all out.
A similar test to the 2001 Calcutta classic. England followed on 227 behind. Then the scripts diverge. Unlike Calcutta, England were soon hanging by a slender thread at 135 for 7. Botham counter-attacked and was ably supported by Dilley with 56 and Old with 29. Even then Australia were left with a meagre target of 129. Then Willis took over and England won by 18 runs. "Botham's Ashes" was born.
6. MtId: 1458 (1999) 4 of 4 (Eng: 1-1) New Zealand won by 83 runs
Nzl 236 all out.
Eng 153 all out.
Nzl 162 all out (Cairns C.L: 80).
Eng 162 all out.
This was an away match for New Zealand. Even though they took a first innings lead of 83, they slumped to 39 for 6 when Chris Cairns walked in. He counter-attacked, scoring 80 in 93 balls and added 40 with McMillan and 70 with Nash, departing at 149. He scored 80 out of 110 runs while at crease. New Zealand set England a task of 245 to win but won by 83 runs for a memorable away series win.
7. MtId: 1945 (2010) 2 of 3 (Aus: 1-0) Australia won by 36 runs
Aus 127 all out.
Pak 333 all out.
Aus 381 all out (Hussey M.E.K: 134*).
Pak 139 all out.
I would appreciate no snide comments on this test. Insinuations should not mar the wonderful innings played by Michael Hussey. Pakistan took a lead of over 200 runs and Australia were barely in front with 8 wickets down. Siddle played the unlikely support role to help Hussey add 123 for the ninth wicket. Hussey remained not out on 134 and gave his bowlers some chance against an unpredictable Pakistani batting lineup. They obliged by collapsing for 139.
8. MtId: 1444 (1999) 1 of 4 (Ind: 0-0) Pakistan won by 46 runs
Pak 185 all out.
Ind 223 all out.
Pak 316 all out (Saeed Anwar: 188*).
Ind 232 all out.
Pakistan recovered from 36 for 6 to 185, thanks to Moin Khan. India took a small lead. Then Saeed Anwar played a Gooch-type innings although the bowling was probably not comparable. He carried his bat for 188 and there was only one other fifty, by Yousuf. Saeed Anwar scored nearly 60% of his team's total. As often happens, the bowlers completed the job and Pakistan won by 46 runs. Spare a quiet thought for Srinath who is one of four bowlers who captured 13 wickets in a Test and still finished on the losing side.
9. MtId: 1169 (1991) 4 of 5 (Win: 1-0) West Indies won by 343 runs
Win 149 all out.
Aus 134 all out.
Win 536 for 9 wkts (Greenidge C.G: 226).
Aus 208 all out.
Two very small first innings led West Indies ahead by a mere 15 runs. Then the innings changed completely, thanks to Greenidge's patient 226, lasting over 11 hours. He was well-supported throughout, with five of the first six batsmen crossing 25. Not an innings as attacking as Jayasuriya's but no less valuable. The West Indian pacemen ensured that Greenidge's innings did not go in vain and they won quite comfortably.
10. MtId: 0058 (1899) 1 of 2 (Saf: 0-0) England won by 32 runs
Eng 145 all out.
Saf 251 all out.
Eng 237 all out (Warner P.F: 132*).
Saf  99 all out.
England were behind by 106 runs. Then Warner batted his way through the England second innings and scored 132, carrying England to a total of 237. Even then South Africa needed to score only 132 runs to win but collapsed for 99. Shades of this innings in Gooch's and Saeed Anwar's innings.
11. MtId: 0446 (1958) 1 of 5 (Win: 0-0) Match drawn
Win 579 for 9 wkts.
Pak 106 all out.
Pak 657 for 8 wkts (Hanif Mohammad: 337).
Win  28 for 0 wkts.
This is the first of two innings which helped their teams draw the test from way-behind situations. Pakistan followed on, 473 runs behind, that too at Kensington Oval and few would have given them any chance of avoiding a massive innings defeat. Hanif, the other little master, had other ideas. In an amazing display of stamina, concentration and temperament, he batted for just over 16 hours and scored 337 runs before being 8th out at 649. Pakistan saved the test and this is the innings against which other rear-guard efforts should be measured.
12. MtId: 0732 (1974) 2 of 5 (Win: 1-0) Match drawn
Eng 353 all out.
Win 583 for 9 wkts.
Eng 432 for 9 wkts (Amiss D.L: 262*).
Win DNB.
This was similar to the previous test I have referred to. Only difference being that England trailed by 230 runs. Amiss remained not out with 262 after a near 10-hour vigil and England saved the test quite comfortably. The two interesting points on Amiss' innings were the high % of team score (60.6%) and the lack of support, the next highest innings being Jameson's 38. This innings certainly matches Hanif's effort. The series was kept alive and England manage to save the series by winning the last test.
13. MtId: 1206 (1992) 3 of 4 (Saf: 0-0) South Africa won by 9 wickets
Ind 212 all out.
Saf 275 all out.
Ind 215 all out (Kapil Dev N: 129).
Saf 155 for 1 wkts.
This is the lone third innings effort in this selection which could not save the test. I debated a lot between this innings of Kapil Dev and Asif Iqbal's 146 against England. Finally what tilted Kapil Dev's innings for selection was the fact that his brave effort was performed in South Africa and he helped India set a target of 155. Granted that South Africa achieved this comfortably but at least there was a total to defend. Asif Iqbal's effort is equally praise-worthy and another time I might select that. Kapil came in at 31 for 6 and Asif came in at 53 for 7. The South African bowling was, however slightly better.
Now for the innings which almost made it. All these are wonderful innings and would have graced the top selection list. There are given in no particular sequence. Before readers come in with their own selection, they are advised to check this list also.
155 Tendulkar     1405 (1998) IND vs Aus
180 Trescothick   1734 (2005) ENG vs Saf
144 Taylor        1170 (1991) AUS vs Win
102 Vengsarkar    1047 (1986) IND vs Eng
73  Flintoff      1758 (2005) ENG vs Aus
237 Saleem Malik  1269 (1994) PAK vs Aus
150 Randall        840 (1979) ENG vs Aus
76  Rhodes        1243 (1995) SAF vs Aus
118 Saeed Anwar   1403 (1998) PAK vs Saf
159 Armstrong       76 (1902) AUS vs Saf
152 Chamara Silva 1822 (2006) SLK vs Nzl
146 Asif Iqbal     623 (1967) PAK vs Eng
26  Gillespie     1714 (2004) AUS vs Ind
The last selection might cause a few eye-brows to be raised. I feel that this was an all-time classic late-order innings which saved the day for Australians who went on to win the series. If Gillespie had departed early on the fourth day, India would have won comfortably well before rains opened up. 165 balls on a turning wicket against Kumble and Harbhajan was no mean task. The dead-bat defensive technique of Gillespie is today emulated by another tall, gangly, long-haired fast bowler, Ishant Sharma.
As I have mentioned in my comment, I have started a "Readers' Bakers' dozen". The first cut is presented below. Will be fine-tuned as we go along. Not in any particlualr order.
Thorpe 200 vs Nzl
Sobers 198 vs Ind
Slater 123 vs Eng
Kirsten 275 vs Eng
Trumper 159 vs Saf
Hammond 177 vs Aus
Pietersen 158 vs Aus
Laxman 167 vs Aus
May 285 vs Win
Afridi 141 vs Ind
Nourse 231 vs Aus
Richards 110 vs Eng
Imran 136 vs Aus
Compton 184 vs Aus
M Crowe 299 vs Slk
and a tribute to the minnows (outside the Xiii).
Andy Flower's 199 or Whittall's 188
Ashraful's 114 vs Slk or Khaled Mashud's 103 vs Win
A graphical analysis of Test series results across the years
Last week I did an analysis of the Test match results by series. In view of the length of the article and the need to get and incorporate user responses, I decided to do this as a 2-part article. I am glad that I did this way. I have had excellent responses from the users and this has added a lot of value to the follow-up article. I feel that this is one follow-up article which was turned 180 degrees through the user responses. I have made significant improvements and have also changed the very basis for measuring the teams.
1. The basic method of determining the performance index has been changed based on excellent suggestions by and the extensive dialog I had with Raghav Behani. He himself added value to suggestions put up by Topa Singh. More details later.
2. Coming-from-behind series wins are recognized. Thanks to Dhaval/Anand for suggesting this. More details later.
3. There will be an adjustment in points secured in the series with 1/2 matches.
4. A 3-1 win will carry lesser points than 3-0, a 2-1 win will carry lesser points than 2-0 and so on.
Shankar had made a useful suggestion that all the away series which did not have neutral umpires should get higher weights. The suggestion is eminently valid as all teams, without exceptions, had some dubious members of the umpiring fraternity. However the whole thing is muddled with one neutral umpire scheme starting at various times in different countries. I am not able to work out a clear time-line.
Performance Index
For the Test match analysis, I had done a 0-1-2 points for wins. It came out quite well. For the Series analysis I did not like this over-simplified point allocation because of the widely varying number of Test matches. Then Raghav came back with a suggestion that I do this based on the maximum points available for each series. This would reduce the imbalance problem and provide proper weight. This idea of keeping the denominator at the maximum points did not strike me until Raghav pointed that out. This was a fantastic suggestion and my thanks to Raghav and Topa Singh for this. As Raghav mentions, this will let us do some important analytical studies of some of the famous rivalries like Ashes, India-Pakistan, India-Australia et al.
Of course it required some fine tuning. It is quite easy to win the one Test in a 1-0 series and get full 100% credit. To do that in a 6-Test series is very difficult. Why, it has never been done in history of Test match cricket. Hence some downward and upward adjustment of points is called for, as summarized below.
1-Test series: Multiply secured points by 0.75.
2-Test series: Multiply secured points by 0.875.
3-Test series: No change.
4-Test series: No change.
5-Test series: Multiply secured points by 1.125.
6-Test series: Multiply secured points by 1.25.
A comprehensive series-based analysis of results
Couple of weeks back I did an analysis of the Test match results by periods. I am confident that the readers derived a lot of new insights into the performance of teams. I had also done a graphical analysis of the teams over the years. Amit Patel had suggested that the analysis be done by series. A simple but very sound suggestion since the series wins are the ultimate objective of any teams. Individual tests are only the means to this end. Hence I decided to do a comprehensive Series-based analysis.
What is a series? There have been 150+ one-Test series, and moving upwards to 34 six-Test series. I have defined a Test series as any bilateral contest between two teams. Even the one-Test series has been considered as a Test series. The minimal nature of the contest has been taken care of in the point allocation. Until now there have been 605 series played during the past 133 years.
Out of these 605, three have been triangular tournaments. The first was held during 1912 between England, South Africa and Australia. There were 9 matches and no Final. I have treated this as 3 bi-lateral series. A 3-match England-Australia series with England as home team. A 3-match England-South Africa series with England as home team. Finally a 3-match South Africa-Australia series on neutral grounds. Then the individual Series dynamics take over.
The second was the Asian championships during 1998 involving Pakistan, India and Sri Lanka. There were three round-robin matches followed by a Final. The match between India and Pakistan in India has been treated as a one-Test series with India as home team. Two matches were then played in Sri Lanka. The matches between Sri Lanka and Pakistan/India have been treated as one-Test series with Sri Lanka as home team. Finally the Final between Pakistan and Sri Lanka in Pakistan has been treated as a one-Test series with Pakistan as home team.
The third was the Asian championships during 2001 involving Pakistan, Bangladesh and Sri Lanka. There were two round-robin matches followed by a Final. The match between Bangladesh and Pakistan in Bangladesh has been treated as a one-Test series with Bangladesh as home team. The match between Sri Lanka and Bangladesh has been treated as one-Test series with Sri Lanka as home team. Finally the Final between Pakistan and Sri Lanka in Pakistan, played after a gap of 6 months, has been treated as a one-Test series with Pakistan as home team.
Other than the 1912 triangular tournament referred to above, 4 Test series have been played on neutral locations. These are Pakistan vs West Indies at Sharjah during 2002, Pakistan vs Australia at Sri Lanka during 2002, Pakistan vs Australia at Sharjah during 2002 and recently, Pakistan vs Australia at England during 2010. These four series carry "neutral" tags for both teams concerned. Sharjah could be termed "home" for Pakistan from many points of view. However it is fair to designate that as neutral. Thankfully, even though Pakistan cricket has gone through troubling times periodically, the neutral venues have ensured that we do not lose out on watching one of the most exciting teams in world cricket.
Now for the allocation of points for series results. I have given below the basis for points allocation.
1. Scoring method: I will not adopt the 2-1-0 method which I adopted for the Test matches. That was acceptable there since those were only single Test matches. They might be part of a longer series. However the impact was confined to the specific 3+ days. On the other hand, a series is a much greater contest and could be conducted over 3 months. The Test matches were played over different grounds and weather conditions. It would be unfair to use a simple 2-1-0 method. After all a series can range from a 0-0 draw in a 1-Test series to 5-1 in a six-test series. Hence I have adopted a more complex method of allocating series points, described below.
2. Series wins: In general, a 5-x series win will get more points than a 4-x series win, a 4-x win more points than a 3-x win, a 3-x win more points than a 2-x win and a 2-x win more points than a 1-0 win. This certainly makes sense since this rewards the extent and quantum of win. the minimum points for a series win is 3.0 for a 1-0 win in a 1-Test series at home. The maximum points, theoretically since this has not yet happened, is 15.0 points for a 6-0 away win. It is also necessary to mention that there has never been a 6-0 series win. The table is shown below.
4. Series draws: I will allocate more points, for both teams, for a 2-2 draw than a 1-1 draw. Similarly a 1-1 draw will carry more points than a 0-0 draw. Obviously a 2-2 draw is possible only in a 4+ match Test series. This makes more sense since the score draws deserve higher consideration than score-less draws. And so for other draws. There has never been a 3-3 draw in Test history. The table is shown below.
3. Series losses: A series might be lost 0-6, 1-5, 2-4, 2-3, 1-2 et al. Not all these losses are the same. The teams which have fought hard to win at least one or two Tests deserve some consideration. Hence I have allocated some token points for Test match wins in losing series. In other words, a 3-0 win will give x points to the winning team and 0 point for the losing team. A 3-2 win will give the same x points to the winning team and y points to the losing team. So the differential points will be reduced for closer wins. The table is shown below.
5. Win points in series wins: The series wins for 1-Test rubbers will get the lowest points, for 2-test rubbers more, for 3-Test rubbers still higher and maximum for 4/5/6-test rubbers. Again understandable since it is more difficult to achieve the wins in longer rubbers.
6. Dead rubbers: There is a misconception regarding dead rubbers. People complain about dead rubbers only when the leading team takes it easy and loses. If a team is leading 3-0 and wins, now everyone appreciates the ruthlessness of the winning team and exhorts them to go for a clean sweep. Finally no team wants to lose a Test, whether they are leading 3-0 or trailing 0-3. Having said that, I have given lower weight for the dead rubber results. Some fine tuning still needs to be done for this.
7. Away bonus: Away results, wins and draws, will carry an additional weight of 25%. Less than a third of the series (31.1%) are won away. It is far more difficult to win a series away than a Test away. Hence this significant weight. Since the weight is applied on the points secured, short series away wins carry correspondingly lower points.
8. Neutral bonus: Neutral results, wins and draws, will carry an additional weight of 12.5% for both teams.
9. Team Strength adjustment: The relative strengths of the teams are finally applied to the series points secured. The factor varies from 125% (for Bangladesh performance against Australia in 2003 et al) to 75% (for Australia performance against Bangladesh in 2003 et al). About 10 series qualify for these extreme adjustments. Then the weaker teams start improving and the adjustment becomes 122%/78% and so on. The relative Team Strength indices are used to arrive at this factor.
10. Series Index: The total points secured for the concerned period is divided by the number of series to get an Index value which indicates the position of the team in the concerned period. An index value of 5.0 is indicative of a very good period for the team. An average value of nearing 6.0 indicates significant domination and nearer 7.0, possibly complete and total domination.
A. Points allocation for winning team for series wins
Max    1-win  2-wins  3-wins  4-wins  5-wins  6-wins (Not yet there)
Tests
1        3      -       -       -       -        -
2        4      5       -       -       -        -
3        5      6       7       -       -        -
4        6      7       8       9       -        -
5        6      7       8       9      10        -
6        6      7       8       9      10       12
B. Points allocation for both teams for series draws
Max     0-0     1-1    2-2
Tests  Draw    Draw   Draw
C. Points allocation for losing teams in series losses
Max     Matches won by losing team
Tests  0-win   1-win   2-wins    (3 wins is not possible)
1       0        -       -
2       0        -       -
3       0      0.50      -
4       0      0.50      -
5       0      0.50     1.00
6       0      0.50     1.00
Before we go on to the tables and graphs, let me identify some outstanding team performances in the form of great streaks. This is a great by-product of this series analysis. And series streaks have a far greater value than Test streaks.
First two wonderful streaks have been identified and presented here. I find it difficult to distinguish between the two. Both are outstanding examples of team performances.
The first is the longest unbeaten streak of test series without losing. Let us trace the path.
West Indies lost the 3-test series to New Zealand by 1-0 (that too a 1-wkt loss).
Then, during the next 14 years, West Indies went on to play 29 series, 17 away, and remained unbeaten, yes, you read it correctly, unbeaten. They won 20 series and drew 9 series. And let us remember, no weak teams. This is the definition of domination, matched by only one team afterwards. Just for information, West Indies gathered 174.5 points during this streak and averaged 6.02 points per series.
The streak came to an end during 1994 when West Indies lost 1-2 to Australia at home.
Now for the other, equally mind-blowing streak.
Australia lost to Sri Lanka 0-1 during 1999 away.
Then, during the next 9 years, Australia went on to play 33 series, 12 away, and had 29 wins, 2 draws (New Zealand and India) and 2 losses. This is the alternate definition of domination, matched by only one team before. Just for information, Australia gathered 196.3 points during this streak and averaged 5.94 points per series. The two losses were the famous 2001 Indian win and the equally famous 2005 Ashes win, both by narrow 1-2 margins.
The streak came to an end during 2008 when Australia lost 0-2 to India away.
The most number of continuous series wins was by Australia during the period 2005-2008 when they had 9 consecutive wins. This streak was book-ended by the 2005 Ashes loss and the 0-2 away loss to India during 2008. The index for this streak was 6.29.
Australia had a 8-series streak of wins just before this one. England also had a 8-series streak way back in 1882. The best sequence for West Indies was a 7-series sequence of wins starting 1983.
Just for information, India has a sequence of 5 wins and 2 draws at the current point. With a win/draw against Australia, this will be extended to 8 series and possibly 9 when the New Zealanders come. But remember that these are not wins.
Since the article has already become quite a long one, I am going to keep the other tables and graphs to the follow-up article. Here I am only going to show the table for all tests combined.
Team       Total  Win Draw Lost Aw-W Aw-D Points Index
Series
An analysis of Test all-rounders using BCG charts
This article is a completely different graphical look at the Test all-rounders and is a continuation of the similar articles related to ODI.
Just to recap, Bruce Henderson of BCG (Boston Consulting Group) had created these charts during 1968 to study the Growth-Share aspects of products/business units. This is an excellent way to study two related variables together. These are plotted on a graph which is split into four equal (or unequal) size quadrants. The placement of a particular player, gives excellent insight into the player's position in the galaxy of all-rounders. However please do not forget that this is clearly a two-dimensional graph between two related variables. Also these are all career figures.
I elected to do an analysis of all-rounders, to start with, for Tests since that offers the clearest two-dimensional look. The all-rounder, based on a traditional definition, is clearly a two-dimensional player, Batting and Bowling. We can derive a lot of insight into the position of all-rounders and their relative strengths by doing the BCG charts.
As usual the real test starts in the selection criteria. Unlike the ODI bowlers and batsmen where a straightforward runs/wkts cut-off was used. Here the situation is too complex for a simple cut-off. We have multiple tasks in front of us. We have to have a reasonable number of players, not too many nor too few. The all-rounder standard should not be diluted. After a lot of trial and error efforts, I have decided on the following criteria.
1. All players who have scored 2000 runs or more and captured 100 wkts or more will be automatically included. This gets 23 players in.
2. Out of the remaining, players who have scored 1500 runs or more and captured 75 wkts or more will be included if their Batting average is better than their Bowling average. The later condition ensures that very average all-rounders like Emburey, Prabhakar, Streak et al are excluded. This gets 9 players in. Some of the players who get in are Faulkner, Armstrong, Mushtaq Mohd et al.
3. Now to take away the bowlers who can bat, players who have scored below 25 runs per test will be removed. This means two players, Warne (21.9 rpt) and Kumble (19.0 rpt) go out. Very fair since these two are not really all-rounders.
4. Also to take away the occasional bowlers who are primarily batsmen, all players who captured below one wicket per test will go out. This is fair since this is an analysis of all-rounders. So Hammond (0.98 wpt), Jayasuriya (0.87 wpt) and Steve Waugh (0.55 wpt) go out. I have been quite hard-nosed about this definition and have not been influenced by the very loose definition of all-rounders. Even though Steve Waugh has been called an all-rounder, there is no way he can be classified as one in view of the fact that he has captured one wicket in two tests.
That leaves 27 all-rounders for analysis.
Now we go to the analysis. This time I will do two different BCG analyses. The first will be based on two qualitative measures, the Bowling average and Batting average. The second will be based on two quantitative measures, Wickets per test and Runs per test. The advantage with this method is that it is not longevity based and gives equal chances to players whether they scored 11126 runs or 1968 runs or captured 431 wickets or 75 wickets.
I have not made any adjustment for the period or home country. My very loose conclusion is that such adjustments are not needed in an all-rounder analysis. If a player played during a batting-centric period, he would have the opportunity to have better batting figures which should compensate for the expected lower bowling figures. If a player played during a bowling-centric period, he would have the opportunity to have poorer batting figures which should be compensated by the expected better bowling figures. Similarly if he played on batting-friendly pitches, his better batting figures should compensate for the lesser bowling figures and vice versa on bowler-friendly pitches.
 a typical BCG all-rounder chart
© Anantha Narayanan
The above represents a typical BCG chart. The players in the top-right quadrant, the red one, are the "Top all-rounders". They are to the right of the Batting average line and above the Bowling average line. The ones in the bottom right quadrant, the green one, are the "Batting centric all-rounders". They bat very well but can at best function as fourth/fifth bowler for the team. Similarly, the top left quadrant, the blue one, contains the "Bowling centric all-rounders". They are normally the leading bowlers for their teams but bat at 7/8. The bottom left quadrant, the black one, represents the "Average all-rounders". They play the supporting roles in both batting and bowling.
Now let us view the graphs. I experimented a lot with the sloping dividing lines, as suggested by Sriraman, but could not work out a clear formula. The basis for a proper slope could not be worked out. Hence I have stuck to the dividing lines parallel to the axes. However I have made two significant changes, as suggested by Murali. The lines are drawn now at the centre but the scaling on either side of the lines is different. This makes for very good viewing despite the lopsided data. Sobers and Kallis cause this lopsidedness on the batting front with their extraordinarily high batting averages. On the other side, Shastri and Hooper cause this lopsidedness with their 40+ bowling averages. The numbers are shown along with the player names. I have also shaded the quadrants with the appropriate colour.
First the qualitative one, based on averages. I have also made my comments on the positioning of players without drawing any conclusions.
 qualitative graph based on averages
© Anantha Narayanan
Imran Khan and Miller are the leading all-rounders in this analysis. Aubrey Faulkner's presence would please the followers of Test cricket across the ages. The under-rated Trevor Goddard of South Africa is a surprise, but well-deserved, presence in this top quadrant. Botham is comfortably in this top group.
The batting centric group of all-rounders is led by the incomparable Sobers and Kallis, both with 55+ batting averages. There is another clutch of four all-rounders led by Greig, Brian McMillan (a surprise entrant - he just about makes it) and two greats of the 1910-20s, Armstrong and Woolley. Cairns just about misses the top quadrant. Two very average all-rounders, with awful bowling averages, Hooper and Shastri just about make it to this quadrant.
The bowling centric is a well-populated quadrant. This group is led by Pollock and has two greats of yonder, Noble and Rhodes. then we have Hadlee, Benaud and Wasim Akram.
The last group has Flintoff, Mankad and Vettori as clear residents. Vaas also belongs here. Bailey and Kapil Dev are on the borderline.
No Player Runs Avge Wkts Avge ARIdx1
A graphical analysis of Test results for teams across the ages
This is a simple analysis of the results of teams across ages. I have split the 133 year period into the following 8 ages.
PreWW1: 1877-1914
PreWW2: 1921-1939
1950s:  1946-1959
1960s:  1960-1969
1970s:  1970-1979
1980s:  1980-1989
1990s:  1990-1999
2000s:  2000-2010
A simple formula is used. Readers might find this a little simplistic but I am working with limited parameters to do justice to such a macroscopic analysis. My idea is to bring to light the teams which performed well during each period and then see how each team performed over the years since they made their debut in international cricket. Many of these insights might be obvious to some of the readers but this article is a single place compendium of team performances across the years. And the normal complaints of comparing players/teams across the ages do not arise in this analysis.
A win carries 2 points. A draw/tie will carry 1 point. The total points will be compiled during the concerned period. This is evaluated against the maximum points available for the team and a Performance % arrived at. There is also a need to recognize away performances. This is especially needed to break deadlocks. Take two teams which have played 10 matches each. Both win 5 matches and draw the remaining 5 matches. Both teams will have a 75% performance index. If team A won 3 away and 2 at home and the other team 2 away and 3 at home, Team A should be considered to have done slightly better. Hence I have provided 25% additional weight for away performances, that too, only for wins and draws. The actual weight given is less consequential than the fact that the away performances are recognized.
This is a simple analysis based on results. The relative team strengths or the series position or the win margins are not considered. That is a totally different type of analysis of Team Ratings.
Reg the Graphs. The first graph is the one covering all 1971 tests. This is across 133 years. This graph can be used to lead on to the other graphs. The Period graphs have been drawn in the order of teams' performances. I have also included the summary table for the period in the right as part of the graph for easier viewing and identification. At the end of the 8 period graphs, the graphs for the teams are drawn.
 Summary of Test results across ages
© Anantha Narayanan
Australia leads the all-time table comfortably with a Performance value of 66.0%. England come next with 59.3%. It may be a surprise that Pakistan edges out West Indies for the third position. This has been a result of the recent fall from grace of the West Indian team. Again it is a surprise that Sri Lanka edges out India for the fifth place although it must be admitted that India has had a 50 year head start to put in some awful years earlier. This has also been made possible by Sri Lanka's strong showing during the 99 tests played during the 2000s. New Zealand is the only leading team to have an overall sub-50% index value.
 Summary of Test results in the 2000s
© Anantha Narayanan
Summary of Test results in the 2000s
© Anantha NarayananThe dominant team during 2000s has been the Australians with a Performance Index (PIdx) value of 84.6%. Even their recent wobble has only got them down a bit. They are still the team to beat. South Africa are next with 66.6% and then India with 63.9%. It is debatable whether India can maintain this ascendant graph over the next few years with the huge void which is going to be created. England, with its periodic high-level performances are in next and Sri Lanka, buoyed by their strong home record, complete the top-5. Pakistan comes in next despite their continuing problems and their inability to play at home. The next 4 teams each have significant daylight between themselves and the team ahead of them. One reason why the 2000s has seen a wider dispersion of the numbers are the increased number of decisive results (only 23.8% draws) and presence of two weak teams.
 Summary of Test results in the 1990s
© Anantha Narayanan
The dominant team during 1990s has again been the Australians with a PIdx value of 69.7%. They have not had the extent of domination they had during the last decade. South Africa are next clocking in at a very close 68.2%. Pakistan, with the lethal bowling attack and great batsmen, are next placed with a PIDx value of 65.0%. The West Indies, not be confused with today's hapless and dispirited team, were fourth placed at 56.8%. India completed the top-5 barely crossing 50%. Sri Lanka, England and New Zealand were closely bunched around the 45% mark and even Zimbabwe clocked in at a respectable 34%.
The interesting point in this period was the close bunching of the teams. The difference between the first and ninth team was a low 35% as compared to the 2000s where this difference is a whopping 74%. The other surprising feature is the low number of matches played by teams other than the Ashes rivals. There have also been a greater number of draws (35.7%).
 Summary of Test results in the 1980s
© Anantha Narayanan
It would not be a surprise to read the 1980s charts. The dominant team, by a mile, was the great West Indian team, with their quintet of outstanding pace bowlers and feared batting attack. They clock in at 81.2%. Next comes the Imran Khan controlled Pakistan with 61.9%. Now comes the Hadlee-inspired New Zealand with 58.0%. Australia is the only other team to have a 50+%. India's lack of match-winning players kept them in the lower half. England comes in next and finally the new entrants, Sri Lanka. This period witnessed 46.1% draws.
 Summary of Test results in the 1970s
© Anantha Narayanan
The 1970s was an interesting period. Packer and World Series happened. England, probably less affected by WSC than Australia and West Indies were the leading, if not dominant, team with PIdx value of 63.3%. They are followed by four teams with 50+ %, led by West Indies. India, no doubt bolstered by Gavaskar and the spinners, did not do too badly. New Zealand had only a 33.5% index value. A tweak had to be done for this decade. South Africa played 4 tests and won all these. The 100% index value is an anomaly and should be removed from the analysis. This has been done. No major impact, though.
 Summary of Test results in the 1960s
© Anantha Narayanan
The 1960s was very much a defensive era as evidenced by the single digit column of wins for four of the six teams. The three leading teams, West Indies, Australia and England were separated only at the decimal point level, that too only because West Indies had slightly better away results. The close bunching of teams during these two periods, 1960s and 1970s, is a reflection of the parity which existed between the teams. It is also caused by fewer decisive results 42.6% and 47.8%).
 Summary of Test results in the 1950s
© Anantha Narayanan
The post-war period of 40s/50s was probably much better than the later dreary period. Bradman was there to start with. His legacy was continued by strong players. Australia had an outstanding PIdx value of 78.3%. England also had a very good team and were second with 61.7%, very closely followed by the W-driven West Indies. Surprisingly, Pakistan the new entrants were the next team having a better than 50% record. This is probably the best entrance decade for any of the later entrants. One must also allow for the fact that the pitches were conducive to the great strength of Pakistan, their seam bowling. The draw % was around 35%.
 Summary of Test results pre World War 2
© Anantha Narayanan
The in-between Wars period was a two team period with Australia comfortably ahead of England. That England, despite Bradman, were only 7% behind Australia indicates the effective manner in which their strategies, starting with body-line, worked. The newcomers, India, New Zealand and West Indies propped up the table. There was a spurt in the draw % compared to the previous era, 37.1%.
 Summary of Test results pre World War 1
© Anantha Narayanan
There were only three teams before WW1. England were the comfortable leaders during this period, no doubt aided by their bowling attack, led by Barnes and Lohmann. Not to forget Hobbs and Sutcliffe. Only 17.9% of the matches were draws, no doubt contributed by the types of pitches.
Now for the team performance graphs, presented in a different format. I have used line graphs instead of the bar graphs since it is easier to follow the changes. Also the graphs are shown in a chronological sequence. There is no graph for Bangladesh which has had one decade nor for Zimbabwe which has had two decades. It is not possible to derive anything sensible without three decades.
 Summary of Test results for Australia
© Anantha Narayanan
Australia has maintained very steady performance levels throughout the 133 years. they are the only team never to have fallen below 50% in any of the periods. What is important is that Australia have topped in 4 out of the 8 periods, the PreWw2, 1940s-50s, 1990s and 2000s period.
 Summary of Test results for England
© Anantha Narayanan
Barring the 1980s and 1990s, England have always maintained a 60+ % level. That is a consistency which is comparable to that of Australia. They have led the table in two of the eight periods, the 1970s and the Pre-WW1 periods.
 Summary of Test results for West Indies
© Anantha Narayanan
West Indies led the table during two periods, the 1960s and 1980s but have since fallen off drastically, especially during the past decade. Their 80+% can be compared only to the Australians of the 2000s. Compared to the awful 2000s even the average 1990s looks good.
 Summary of Test results for India
© Anantha Narayanan
India have had a poor start, understandable, and had a poor 1980s and barely acceptable 1990s. They recovered in the current decade although the huge chasm is in front of them. The day without the three gladiators at 3/4/5 is looming ahead. The bowling is another major concern. Where are the bowlers to take 20 wickets on good pitches?
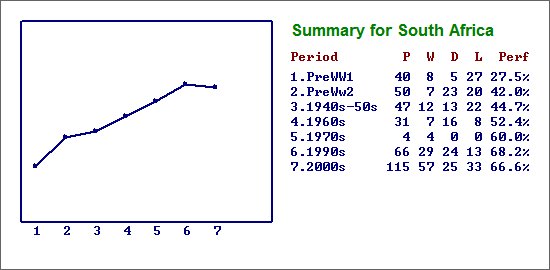 Summary of Test results for South Africa
© Anantha Narayanan
Barring a slight dip in the current decade, South Africa have improved their figures every decade. Possibly the only team to do so. There is a caveat so far as South Africa are concerned. This has already been referred to in the period graph. They played 4 Tests during the 70s and won all. Since I did not want their graph to have an abrupt dip or spurt, I have allotted a notional % for this period. 1980s, of course, is excluded.
 Summary of Test results for Pakistan
© Anantha Narayanan
Pakistan started very well, dropped off, picked up very well again but again fell of during the current decade. Overall they have been quite good. Very understandable in view of the circumstances. We must feel for the talented Pakistanis. As they seem to come out of one problem, another one crops up. Maybe it is time for Imran Khan to come forward and run Pakistan cricket the way he ran his team.
 Summary of Test results for New Zealand
© Anantha Narayanan
New Zealand have been like the proverbial yo-yo. Down, up, down, up and so on.They had a golden 1980s when the kings were scattered around the tropical islands near Florida..
 Summary of Test results for Sri Lanka
© Anantha Narayanan
Sri Lanka have had only three decades and have been steadily improving a la South Africa. However the impressive thing is that their excellent performance of 61+% has been over the last 100 tests, more than a half of their tally.
To view the "Results Summary - By Periods" tables, please click here.
To view the "Results Summary - By Teams" tables, please click here.
An important announcement to the readers. I have created an open mailid to which the comments and suggestions, not meant for publication, can be submitted. The mail id is ananth.itfigures@gmail.com. Since the readers would have to use a mail route I give the readers my assurance that the mail id is safe and will never be used by me for anything other than communicating with the reader specifically. This will not be part of any group mail nor will mails be cc'd.
This article is a completely different graphical look at the ODI bowlers and is a continuation of a similar article on ODI batsmen
Just to recap, Bruce Henderson of BCG (Boston Consulting Group) had created these charts during 1968 to study the Growth-Share aspects of products/business units. This is an excellent way to study two related variables together. These are plotted on a graph which is split into four equal (or unequal) size quadrants. The placement of a particular player, gives excellent insight into the bowler's position in the galaxy of bowlers. However please do not forget that this is clearly a two-dimensional graph between two related variables. Also these are all career figures.
Bowling is a far more cleaner and crisper playing aspect which lends itself to excellent analysis. There are only two independent variables, bowling strike rate and bowling accuracy, in the form of Rpb. These two together can be used to generate the bowling average, which is a single measure incorporating the two constituent parameters very clearly, unlike the batting average which has the dicey not outs concept embedded within. The bowling strike rate is represented in X-axis and the bowling accuracy (Rpo or Rpb, it does not matter what we take) in the Y-axis. The only special requirement is that, in bowling both variables have reverse-effectiveness in that the lower these are the better the bowler is. hence I have laid down the axis from the highest to lowest values.

© Ananth Narayanan
The above represents a typical BCG chart. The bowlers in the top-right quadrant, the red one, are the "Top bowlers". They are to the right of the Bowling strike rate line and above the Rpo line. The ones in the bottom right quadrant, the green one, are the "Attackers". They capture wickets quite frequently but go for plenty of runs. Certainly an asset, but could do better. Similarly, the top left quadrant, the blue one, contains the "Defenders". They take more balls to capture a wicket but are miserly. They are equally valuable as the Attackers. The bottom left quadrant, the orange one, represents the "Also rans". They fall behind in both areas and lag behind the others.
As I explained in the batsmen article, the two central dividing lines can be drawn in two ways. One is to draw the same right in the middle. However this does not take into account the distribution of values. The alternative method is to draw the lines around the median value so that we get around half the bowlers on top of the mid line of the Rpo and around half the bowlers to the right of the mid line of the Bowling strike rate line. This leads to unequal quadrants but would make analysis of the bowlers far more meaningful. Let me add that the drawing of the asymmetrical central lines is my own idea and most of the BCG charts have only centrally located divider lines. However my idea of asymmetrical dividing lines ensures a fairer distribution of players across quadrants.
Finally the chart is drawn on two criteria. The top wicket-takers and the top bowlers based on bowling averages, the minimum wickets requirement for the later selection being 100 wickets.
I have also changed the graph presentation method. I have used Gaurav's suggestion and drawn fixed diameter circles supported by numbers. There is a legend at the right hand side to link the numbers to the bowler names. It has come out very well and the graph is now uncluttered.
The first chart is drawn with the wickets captured as the criteria. 200 wickets are the cut-off for selection. Anything fewer will clutter up the graph. Already I feel we are over-populated. The median Strike rate is 38 and the median Rpo is just short of 4.3. The dividing lines are drawn around these figures. These lines split the distribution approximately equally on either side. Let us now look at the chart.
 Graph of runs scored
© Ananth Narayanan
The "Top performers" are led by Glenn McGrath and closely followed by Muttiah Muralitharan and Wasim Akram. Donald and Saqlain have excellent strike rates and quite good Rpo figures. Hence they are also in this quadrant. Warne and McDermott have taken more balls to capture a wicket but are also comfortably in the top bowlers quadrant. It is difficult to question the credentials of any of these ODI greats.
The "Attackers" group is led by Lee, Waqar Younis and Shoaib Akhtar. Incidentally these two Pakistani greats are almost like Siamese twins with almost identical figures (30.5/4.69 and 30.7/4.69). Agarkar has excellent strike rate but is a millionaire when it comes to conceding runs. Ntini has similar strike rate but is far more economical. Srinath, Gough and Zaheer just about make it to this quadrant.
The "Defenders" group is led by Ambrose and Pollock. they are followed by Kapil Dev and Walsh. A few other modern spinners, Harris, Vettori, Kumble and Harbhajan are at the border-line.
The "Also rans", has Afridi and Jayasuriya as prominent members. These are followed by Streak, Razzaq, Cairns and Kallis.
Lee is the outlier as far as the strike rate is concerned with a sub-30 Bpw figure. The three Pakistani greats have just over 30. Ambrose is the outlier as far as Rpo is concerned with a sub-3.5 figure. Pollock and Kapil Dev follow next.
The second chart is drawn with the Bowling average as the criteria. 26.00 is the cut-off with a minimum of 100 wickets. The median Strike rate is around 34 and the median Rpo is around 4.2. The dividing lines are drawn around these figures. These lines split the distribution approximately equally on either side. Let us now look at the chart. The selected bowlers are distributed around the whole graph quite well.
 Graph of runs scored
© Ananth Narayanan
This selection is far more stringent because of the dual cut-offs. There are only two bowlers in the "Top performers" quadrant. Only McGrath and Donald make the cut. Their positioning is also intriguingly close to the middle lines. McGrath is more economical but takes a few extra deliveries per wicket. Donald is the other way around. Two of the greatest of ODI bowlers ever.
Lee leads in the "Attackers" group and is closely followed by the Siamese-twins, Waqar Younis and Shoaib Akhtar. Saqlain is also very close to the top performer quadrant. Bond is another exciting new entry who is in a similar position. Maharoof and Flintoff are also in this group.
Lillee and Muralitharan are the leaders in the "Defenders" group and these two are quite close to the top performers. Joel Garner is a well-deserved new entrant here and has an outstanding economy rate. Wasim Akram is well-placed here. This group also has other wonderful ODI bowlers like Hadlee, Pollock, Ambrose and Holding.
Warne is in the fourth quadrant but is very close to the Rpo dividing line. Fleming is close to the Strike rate dividing line. Because we have taken only bowlers of average 26 and below, there are very few poor performers.
Lee is the outlier as far as the strike rate is concerned with a sub-30 Bpw figure. Bond follows him. Garner is the outlier as far as Rpo is concerned with an amazing 3.1. Hadlee and Holding follow him.
There is a clear trend here. Where the bowlers are clustered together, the concentration is on the middle performance quadrants. There are very few bowlers in the high performance and low performance quadrants. This trend is different to the wickets based graph where the bowlers are scattered all over the graph. Hence there are more players are present in the extreme performance quadrants.
I have also drawn the charts for the top players by Strike rate. Unlike the corresponding batting chart, this has got excellent distribution all over the graph. This is mainly because the Bowling strike rate values are closely bunched together. The top group is led by Donald, Saqlain and Bond. The chart can be seen below.
 Graph of runs scored
© Ananth Narayanan
The last one is the chart of the top bowlers by Rpo. Here also there is good distribution. The leading bowlers are Lillee, Hadlee, Holding, McGrath, Wasim Akram and Muralitharan. What a collection of greats. The chart can be seen below.
 Graph of runs scored
© Ananth Narayanan
I will attempt a similar analysis on Test Batsmen/Bowlers. I think I have got the two variables for batting identified. That will be the Batting average and Average career weighted bowling quality faced. The results seem to be coming out very well. Readers are welcome to give their suggestions.
An important announcement to the readers. In one of my comments I had mentioned that I would create an open mail id to which readers could send their suggestions. To start with I would appreciate if readers can send in their suggestions on batting and bowling performances in the third innings or the Test batting BCG charts. I will complete my work and depending on the reader responses will incorporate a few popular performances amongst these. Please note that this is a one-to-one communication and the contents will not be published. Please continue to use the blog posting method for the comments you want to be published. This is not my mail id and has been created only for this purpose. To separate the spam, it will be a nice idea if all readers can follow a simple idea of making their title as "It Figures Blog: ..............".
The mail id is ananth.itfigures@gmail.com
Since the readers would have to use a mail route I give the readers my assurance that the mail id is safe and will never be used by me for anything other than communicating with the reader specifically. This will not be part of any group mail nor will mails be cc'd.
A look at top ODI batsmen using BCG charts
This article is a completely different graphical look at the ODI batsmen and has been inspired by the work done by my friend Arvind Iyengar who did a similar analysis in a cricketing site to which we both contribute. I have done some significant changes and increased the scope of analysis.
Bruce Henderson of BCG (Boston Consulting group) had created these charts during 1968 to study the Growth-Share aspects of products/business units. This is an excellent way to study two related variables together. These are plotted on a graph which is split into four equal (or unequal) size quadrants. The placement of a particular product, in this case, the batsman, gives excellent insight into the batsman's position in the galaxy of batsmen.
Arvind had drawn the chart between Batsman strike rate and Batting average. I felt that the Batting average was a wrong variable since that is arrived at by multiplying Strike rate and Average balls per innings. Consequently the Strike rate is represented in both X and Y axis. hence I have changed the Axis variables to Strike rate and Average balls per innings.

The above represents a typical BCG chart. The batsmen in the top-right quadrant, the red one, are the "Top performers". They are to the right of the Strike rate line and above the Average balls per innings line. The ones in the bottom right quadrant, the green one, are the "Dashers". They score quite fast but do not last for many balls. Certainly an asset, but could do better. Similarly, the top left quadrant, the blue one, contains the "Stayers". They last long but score relatively slowly. They are probably more valuable in the ODI game. However the dashers are likely to be more valuable in the T20 game. The bottom left quadrant, the orange one, represents the "Also rans". They fall behind in both areas.
A few things are to be made clear. I have used the Average balls per played innings rather than the balls per dismissed innings. This is to make the analysis fairer across all batsmen since the later measures would benefit the middle order a lot, possibly out of proportionately.
The other thing is that the two central dividing lines can be drawn in two ways. One is to draw the same right in the middle. However this does not take into account the distribution of values. The alternative method is to draw the lines around the median value so that we get around half the batsman on top of the mid line of the Average balls per innings and around half the batsmen to the right of the mid line of the Strike rate line. This leads to unequal quadrants but would make analysis of the batsmen far more meaningful. Let me add that the drawing of the asymmetrical central lines is my own idea and most of the BCG charts have only centrally located divider lines. However my idea of asymmetrical dividing lines ensures a fairer distribution of players across quadrants.
Finally the chart is drawn on two criteria. The top run getters and the top batting averages are used as different criteria, the minimum runs requirement for the later selection being 2500.
The first chart is drawn with the runs scored as the criteria. 6500 runs are the cut-off for selection. Anything fewer will clutter up the graph. Already I feel we are over-populated. The median Strike rate is around 76 and the median Average balls is just short of 45. The dividing lines are drawn around these figures. These lines split the distribution approximately equally on either side. Let us now look at the chart. At the end I have also shown the alternate graph in which the dividing lines are drawn right in the middle.
 Graph of runs scored
© Ananth Narayanan
The "Top performers" are led by Tendulkar and include Ponting, Lara, Mark Waugh, Saeed Anwar and Richards. It is difficult to question the credentials of any of these ODI greats. Gayle just about falls short of breaking in. The "Dashers" group is led by Gilchrist, Sehwag, Jayasuriya, Gayle and Yuvraj. Quite a few attacking batsmen also fill this group. The "Stayers" group is led by Haynes and is followed by Kallis, Ganguly, Miandad and a few others. The strugglers group, the "Also rans", has Border, Fleming and Azharuddin as the prominent members. Andy Flower and Sangakkara are in this group but are quite close to the central point. Sangakkara could move out of this group by either increasing his scoring rate or average balls.
The second chart is drawn with the Batting average as the criteria. 40.00 is the cut-off with a minimum of 2500 runs. The median Strike rate is around 76 and the median Average balls is around 46. The dividing lines are drawn around these figures. These lines split the distribution approximately equally on either side. Let us now look at the chart. The selected batsmen are distributed around the whole graph quite well. Hence the mid-point graph is not necessary. It will be almost the same as this one.
 Graph of batting average
© Ananth Narayanan
The "Top performers" are Tendulkar, Zaheer Abbas, Hayden and Ponting. No one else is even on the border. Richards leads in the "Dashers" group and is followed by de Villiers, Dhoni, Hussey and Pietersen. Greenidge and Haynes top the "Stayers" group which also has Jones, Ganguly and Bevan. The last "Also ran" group has very few members. Even amongst these, Sarwan, Clark and Martyn are very close to the centre line of the Strike rate. It is easy to conclude that once we select batsmen with averages of 40.00 it is difficult to find really average performers. They compensate for deficiency in one with the other. Lara, Sarwan, Clark and Mohd Yousuf are quite close to the central point.
I had also drawn the charts for the top players by Strike rate. This is quite a lop-sided graph since there is a huge gap between the strike rates of the top batsmen (113, 103, 96 ...). Surprisingly many of these players have fairly high Balls per innings. Hence the graph is heavy with players on the left side.
 Graph of strike rate
© Ananth Narayanan
In addition, I had also drawn the charts for the top players by Average balls played. This is also quite a lop-sided graph since there is a huge gap between the balls played values of the top batsmen (67, 62, 57 ...). Surprisingly many of these players have decent strike rates. Hence the graph is heavy with players on the bottom.
 Graph of average balls played
© Ananth Narayanan
To view/down-load the graph of top run-makers with an equal quadrant size split, please click/right-click here. The graph is self-explanatory. As I feared, this is a totally unacceptable presentation. Just one player, Tendulkar makes it to the "Top performers" group.
I will next do a similar analysis on ODI bowlers. The intriguing feature in this graph will be that for both Bowling strike rate and Bowling Rpo, the lower the value is the better the bowler. In other words, the quadrants will exchange their significance. Readers are welcome to give their suggestions.
An important announcement to the readers. In one of my comments I had mentioned that I would create an open mail id to which readers could send their suggestions. To start with I would appreciate if readers can send in their suggestions on which batting and bowling performances in the third innings can be considered. I will complete my work and depending on the reader responses will incorporate a few popular performances amongst these. Please note that this is a one-to-one communication and the contents will not be published. Please continue to use the blog posting method for the comments you want to be published. This is not my mail id and has been created only for this purpose. To separate the spam, it will be a nice idea if all readers can follow a simple idea of making their title as "It Figures Blog: ..............".
The mail id is ananth.itfigures@gmail.com
Since the readers would have to use a mail route I give the readers my assurance that the mail id is safe and will never be used by me for anything other than communicating with the reader specifically. This will not be part of any group mail nor will mails be cc'd.
A look at top bowling performances in the fourth innings in Tests
As a follow-up to the epochal fourth innings batting performances, this analysis covers the great bowling performances. Again let me emphasize that this is a predominantly objective selection, based loosely on the Wisden-100 tables, but also incorporating my own perceptions. Let me also emphasize that this covers only individual bowling performances, not team bowling performances. That is for a later article.
This also makes the search for non-winning great performances in fourth innings quite difficult. After searching far and wide, I have been able to locate two such performances. Consequently 11 of these 13 performances have been winning ones. Only one has been in a dead rubber situation. There is a fair distribution over the years. One pre-WW1, two are bowling performances in between wars and the rest after WW2 including one during the current decade. The countries are well-represented.
Let us look at the 13 performances. These performances are presented more or less in the Wisden-100 list order. Not that the order matters. Readers should note that the complete bowling spell is indicated by the term "innspell" and a specific unbroken bowling stint is called "spell".
1. MtId: 0437 Year: 1957 Test# 4 of 5 (0-2) South Africa won by 17 runs
Saf 340 all out.
Eng 251 all out.
Saf 142 all out.
Eng 214 all out (Tayfield H.J: 37.0-11-113-9).
South Africa took a useful first innings lead of 89 runs but were then dismissed for 142 by a strong English bowling attack. England, with an excellent batting lineup led by May, Compton and Cowdrey looked poised to score the 230 runs needed. The fearsome pair of Adcock and Heine did very little. Then Tayfield took over and bowled 37 consecutive 8-ball overs and captured 9 English wickets for 113 runs taking South Africa to an unlikely narrow win. The low target, quality of English batting and the number of wickets captured meant that Tayfield's innspell was adjudged the best ever bowling bowling performance in the Wisden-100 analysis. There can be very few dissenters to this conclusion.
2. MtId: 1443 Year: 1999 Test# 2 of 2 (0-1) India won by 212 runs
Ind 252 all out.
Pak 172 all out.
Ind 339 all out.
Pak 207 all out (Kumble A: 26.3-9-74-10).
As matches go, this was a veritable rout by India. Pakistan's poor first innings, coupled with India's effective second innings meant that Pakistan had before them an impossible task of scoring 420 runs on a wicket turning square. I would not normally have placed Kumble's 10-wicket innspell in the top drawer amongst fourth innings bowling performances taking into account all these conditions. However the fact that this was a historic innspell, one of only two achieved by bowlers in 133 years has made me select this. It is also the second best innspell in the Wisden-100 tables. Kumble bowled beautifully taking full advantage of the turn and bounce offered. The miracle was not the 10-wicket haul but the fact that three other excellent bowlers bowled 34 overs and did not pick up a wicket. It was also very sporting of the Pakistan batsmen not to have gifted their 9th or 10th wicket to someone else.
3. MtId: 1804 Year: 2006 Test# 3 of 3 (1-0) Sri Lanka won by 134 runs
Slk 231 all out.
Eng 229 all out.
Slk 322 all out.
Eng 190 all out (Muralitharan M: 30.0-11-70-8).
Two average first innings, followed by a very good Sri Lankan second innings, meant that England had a tough task of 325 runs, albeit on their own home ground. Then Muralitharan bowled his heart out and captured first 7 wickets, before Hoggard was run out. Then he captured Lewis' wicket and there was a swinging last wicket stand which was ended by Jayasuriya. Muralitharan had the outstanding figures of 8 for 70 and Sri Lanka tied the series. This is the only performance of the current decade included in this selection. This was also at Nottingham, not at Kandy or Galle.
4. MtId: 0179 Year: 1929 Test# 4 of 5 (0-3) England won by 12 runs
Eng 334 all out.
Aus 369 all out.
Eng 383 all out.
Aus 336 all out (White J.C: 64.5-21-126-8).
This is the only dead-rubber performance included. England had an unbeatable 3-0 lead against Australia in Bradman's welcome series. Three healthy innings left Australia to score 349 runs to win. White, the slow left arm spinner, bowled 65 overs, almost continuously, against the strong Australian lineup and captured 8 wickets for 126 runs. A margin of 12 runs reinforces the magnificence of the innspell.
5. MtId: 0905 Year: 1981 Test# 3 of 6 (0-1) England won by 18 runs
Aus 401 for 9 wkts.
Eng 174 all out.
Eng 356 all out.
Aus 111 all out (Willis R.G.D: 15.1-3-43-8).
This is more known as Botham's test (and Ashes). However, there is no doubt that the win was set up by Botham but was achieved by Willis with his magnificent innspell, defending a very low total of 130. England, after following on and 82 in arrears at the fall of the seventh wicket, were rescued by Botham, with support from Dilley and Old. Then Willis took over and this was one of the most devastating fourth innings bowling performances ever. Incidentally the first 5 performances occupy the first 5 positions in the Wisden-100 table.
6. MtId: 1243 Year: 1994 Test# 2 of 3 (0-0) South Africa won by 5 runs
Saf 169 all out.
Aus 292 all out.
Saf 239 all out.
Aus 111 all out (de Villiers P.S: 23.3-8-43-6).
This match has some similarities to the Botham/Willis match. The target was even lower at 116. Australia, with its strong batting lineup was expected to waltz through. However SCG always offers help for the faster bowlers and de Villiers took over the defence of the meagre total.He captured the first 4 wickets. Then Donald moved in and claimed the next 3 wickets. Australia rallied through McDermott and reached 110 for 8 and looked like winning. Then Warne was run out and de Villiers dismissed Healy and McGrath to carve out a 5 run win. In some ways this must be the unlikeliest win, comparable to West Indies win by a single run, an year earlier. And let us not forget who was bowling at the other end, the white lightning, Donald.
7. MtId: 0849 Year: 1979 Test# 1 of 2 (0-0) Pakistan won by 71 runs
Pak 196 all out.
Aus 168 all out.
Pak 353 for 9 wkts.
Aus 310 all out (Sarfraz Nawaz: 35.4-7-86-9).
After two low innings, Pakistan posted a competitive total and set Australia an imposing 381 to win. Sarfraz Nawaz bowled, arguably the finest innspell by a Pakistani bowler and captured 9 wickets for 86 runs to win the match for Pakistan. The other batsman was run out. At 305 for 3, Sarfraz dismissed 5 batsmen for 0. The amazing thing was that 38 overs by Imran Khan and Mushtaq Mohd did not produce a wicket. This was an unlikely bowling performance by a pace bowler. Unlike Willis and de Villiers who ran through Australia in fewer overs, this was somewhat like the innspell of White in that Sarfraz bowled 35 8-ball overs.
8. MtId: 1143 Year: 1990 Test# 3 of 4 (0-1) West Indies won by 164 runs
Win 446 all out.
Eng 358 all out.
Win 267 for 8 wkts.
Eng 191 all out (Ambrose C.E.L: 22.4-10-45-8).
It doesn't often happen that a West Indian pace bowler runs through a team. There are other equally fearsome and intimidating bowlers who participate in the clean-up act. This was a rare instance. England were set over 350 runs to win and Ambrose bowled a Willis-type innspell, capturing 8 wickets for 45 and helped dismiss England for 191. Since the attack included Bishop, Marshall and Moseley, this effort is all the more praise-worthy.
9. MtId: 0390 Year: 1954 Test# 4 of 4 (1-0) Pakistan won by 24 runs
Pak 133 all out.
Eng 130 all out.
Pak 164 all out.
Eng 143 all out (Fazal Mahmood: 30.0-11-46-6).
Pakistan were babes-in-the-wood in this series. This was only their second series, both away. They were pitted against the mighty England, led by Hutton, May, Compton, Graveney, Tyson, Wardle and Statham. They trailed 1-0 and everybody expected England to walk away with a 2-0 series win. Three innings below 165 meant that England's mighty lineup had to score only 167 for a win. England reached 109 for 2, confirming all these predictions. Then Fazal Mahmood, the master of swing, took over and took the next 5 wickets for nothing, finishing with 6 for 46. England were dismissed for 143, leaving Pakistan winners by 24 runs. Pakistan drew the series and Pakistan's pace bowling pedigree, true even today, was appreciated. This must be one of the greatest upsets ever in the history of Test cricket.
10. MtId: 0009 Year: 1882 Test# 1 of 1 (0-0) Australia won by 7 runs
Aus  63 all out.
Eng 101 all out.
Aus 122 all out.
Eng  77 all out (Spofforth F.R: 28.0-15-44-7).
This was the famous "Ashes" test. Three very low innings meant that England had to only score 85 for a win. Spofforth took the central stage and bowled 28 4-ball overs continuously, capturing 7 for 44 and the "Ashes" legend was born. It is quite difficult to comprehend a wicket in which 40 wickets fell for 363 runs and a wicket was captured every 27 balls.However we have to admire Spofforth's effort since this represents the lowest total ever defended. This performance just about gets into the top-50 of Wisden-100 table in view of the very strong bowler-friendly conditions.
11. MtId: 0510 Year: 1961 Test# 4 of 5 (1-1) Australia won by 54 runs
Aus 190 all out.
Eng 367 all out.
Aus 432 all out.
Eng 201 all out (Benaud R: 32.0-11-70-6).
This match has come in purely for my nostalgic sake. This was the first series I was fortunate enough to hear on borrowed radio, in a hostel room as the junior-most student, trying to pull the wool over the warden's eyes and ears. And Benaud was my favourite cricketer. England had taken a lead of 177. Then Lawry pitched tent and with the help of some lusty late-order hitting by Davidson, Australia reached 432. England had to score 255 for a win. Everyone knew that it was a battle between Benaud and the English batsmen, led by the imperious Dexter. Dexter was batting at his commanding beat and England reached 150 for 1. Then Benaud essayed one of the finest spells of leg-spin bowling ever, pitching into the rough created by Davidson. He dismissed Dexter and picked up the next 6 wickets. Davidson and Simpson finished the job and Australia ran out winners by 54 runs. Benaud captured 6 for 70.
12. MtId: 0277 Year: 1946 Test# 2 of 3 (1-0) Match drawn
Eng 294 all out.
Ind 170 all out.
Eng 153 for 5 wkts.
Ind 152 for 9 wkts (Bedser A.V: 25.0-4-52-7).
This is the only drawn match in this list. Even though India were only playing their 9th match, they were quite strong with a lineup boasting of Merchant, Mushtaq, Mod, Hazare, Amarnath and Mankad. England took a first innings lead of 124 and set India a target of 278 to win, a tough ask at Manchester against a powerful English attack. The first two wickets were captured by Pollard. Then Modi and Hazare steadied the ship. However Alec Bedser bowled beautifully and captured the next 7 wickets. India were 138 for 9 and looked like losing. However Sohoni and Hindlekar stood firm and avoided defeat. Bedser's innspell of 7 for 52 represents one of the finest closing innspells in a drawn match.
13. MtId: 0149 Year: 1923 Test# 2 of 5 (1-0) England won by 1 wicket
Saf 113 all out.
Eng 183 all out.
Saf 242 all out.
Eng 173 for 9 wkts (Hall A.E: 37.3-12-63-7).
This is the only innspell included from a losing match. After three average innings, England were set 173 for a win. England had Sandham, Wooley, Mead and Fender in their lineup. Alf Hall, a left arm pace bowler, single-handedly almost denied England a win. He captured 7 for 63, dismissing all the top batsmen. He reduced England to 86 for 6 before Mann and Jupp added 68 runs. Then Hall dismissed both batsmen. He could not claim the last wicket and England ran out winners by 1 wicket. It is worth mentioning here that these were 3-day tests.
The other innspells which came under consideration are listed below.
Statham's 7 for 39 against South Africa during 1955 (a real contender).
R.Peel's 6 for 67 against Australia during 1894.
O'Reilly's 7 for 27 against England during 1934.
Hoggard's 7 for 61 against South Africa during 2005.
McGrath's 8 for 24 against Pakistan during 2004.
Snow's 7 for 40 against Australia during 1971.
Kluesener's 8 for 64 against India during 1996.
Cowans' 6 for 77 against Australia during 1982.
Fazal Mahmood's 6 for 66 against West Indies during 1959.
Underwood's 7 for 50 against Australia during 1968
Warne's 8 for 71 against England during 1994.
Ambrose's 6 for 24 against England during 1994.
Dean Headley's 6 for 60 against Australia during 1998.
Whitney's 7 for 27 against India during 1992.
Kumble's 7/63 against Pakistan at Kolkata in 2005
Gibbs' 6 for 60 against India during 1968 (Drawn match).
In the famous 1-run win by West Indies against Australia during 1993,
the wickets were shared by Ambrose, Bishop and Walsh. Ambrose's 4 for 46 is still
an excellent individual effort.
In a later article we will see team performances in fourth innings. That will do
justice to the multi-pronged bowling attacks.
A look at the finest fourth innings batting performances
The first innings of a test match is a completely open-ended one. What should one aim at? What is a good score? Should one consume time or attack more? Is 225 for 1 at close of play on the first day better than 300 for 4 or vice versa? No one can forecast with any degree of certainty the answers to these questions.
The second innings at least is more defined. There are some targets to aim at. If the opponents score 500 or thereabouts, the first target is to avoid follow-on. If the score in front is around 350, the normal target is to overhaul it. If the first batting has scored 200, the second batting team has to be wary of a difficult pitch but, in general, looks for a substantial lead.
The third innings is clearer. If a team has followed on or trails by a substantial deficit, the first target is to clear the deficit and then build on setting a reasonable target. If the two first innings are comparable, then a substantial target score has to be aimed at. If the team is batting with a substantial lead, then it is only a question of timing the declaration, leaving enough time to win. However the third innings is the one where serious strategising starts. The seeds of the result aimed for are sown here.
However the fourth innings is the purest one. Whatever the team started with is the winning target. It could be 1 or 836 (both are actual targets in test matches). This number is clearly available to both teams. While time/overs/weather are factors, this target never changes. There is no D/L creeping in Tests somewhere there, moving the goal-posts. The innings played which we never forget are also outstanding fighting ones. Great defensive innings, often as valuable as attacking match-winning innings are played in the fourth innings.
Let me mention that the top 7 from the fourth innings performances from the Wisden-100 table find their place here. In addition I have selected 6 more performances. There are 7 winning performances, 4 from drawn matches and 2 from lost matches. There are two innings from pre-ww1 days. Only in the period between the two wars is there no innings selected. This is a reflection of a batting (read Bradman) dominated era. There is one innings from the 1950s.
As I have already said this is my selection, 75% objective and 25% subjective. Readers will have their own favourite fourth innings and are welcome to send in their comments referring to these innings. The only requirement is that you have to take the trouble of looking up the concerned scorecard and give some details. Rather than posting comments such as "What about Inzamam's 95", the comments which are likely to get published are the ones where a better insight into the concerned innings are provided.
Let us look the performances. These are published in reverse chronological order so that no one says why is this in first position or not in first position.
1. MatchId: 1760 Year: 2005 Match drawn.
England:      444
Australia:    302
England:      280 for 6
Australia:    371 for 9 (Ponting 156)
This was the third test in the 2005 Ashes series. The series was tied at 1-1. England got a healthy lead of 142 and then declared leaving Australia to get 423 to win in about 100 overs. Australia lost Langer early. Then Ponting played probably his best match-saving innings for Australia and scored 156. He was dismissed when there were still nearly 5 overs left. However the Australian last wicket pair of Lee and McGrath saw through 27 balls and earned a very honourable draw.
2. MatchId: 1658 Year: 2003 Pakistan won by 1 wkt.
Bangladesh:   281
Pakistan:     175
Bangladesh:   154
Pakistan:     262 for 9 (Inzamam 138*)
If ever Bangladesh is threatened with demotion from Test cricket they should show a video of this match, lost only because of an out-of-the-world innings by Inzamam. Bangladesh scored 281 runs and took a lead of 100+ runs. They were then dismissed for 154, leaving Pakistan the relatively easy task of scoring 261 for a win. The strong Pakistani batting lineup was expected to win comfortably by 6/7 wickets.
From a comfortable position of 62 for 1, Pakistan lost wickets regularly and were soon down at 164 for 7. Inzamam was steady as a rock and added 41 with Shabbir and 52 with Umar Gul. The 9th wicket fell at 257 but Inzamam scored the winning run and carried Pakistan to a wonderful one wicket win. Only the cricket-challenged crowd would dismiss the innings as against minnows. It was far from true and Inzamam's wonderful innings has to be accorded due respect, as also the Bangladeshis.
3. MatchId: 1594 Year: 2002 New Zealand lost by 98 runs.
England:      228
New Zealand:  147
England:      468 for 6
New Zealand:  451 a.o (Astle 222)
The first innings were low-scoring ones and England got a lead of 81. Then they declared leaving New Zealand to score 550 to win in about 190 overs. Astle came in at 189 for 4 and played arguably the most attacking and defiant innings in Test cricket. He scored 222 in 168 balls against a potent English attack of Caddick, Hoggard, Giles and Flintoff. New Zealand scored at nearly 5 runs per over. Chris Cairns came in at no.10 and added 118 for the tenth wicket with Astle.
Only those who did not watch the telecast would say this was an innings in which nothing was at stake. I watched every ball and I could clearly see that the English players were desperate. Met us not forget that there was Chris Cairns, a top all-rounder at the other end. The commentators kept on saying that Astle could not continue this, but he did. For the last two wickets Astle added 150 runs in 15 overs. One more hour of this mayhem and New Zealand would have won.
4. MatchId: 1453 Year: 1999 West Indies won by 1 wkt.
Australia:    490
West Indies:  329
Australia:    146
West Indies:  311 for 9 (Lara 153*)
This classic was rated the second best innings ever in the Wisden-100 list. Australia scored big in the first innings and took a lead of 161 runs. Then Walsh and Ambrose dismissed Australia for 146, leaving West Indies to get 308 for a win. Lara entered at 78 for 3. There was some support from Adams but soon West Indies were 248 for 8. Then Ambrose lasted for nearly 90 minutes and 39 deliveries and helped add 54 for a win. When he was out, West Indies still needed 6 runs for a win.
Walsh, with a 7.5 batting average somehow lasted 5 balls and Lara scored the winning boundary off Gillespie. The bowling attack was a very good one comprising of McGrath, Gillespie, Warne and MacGill. Lara sculpted probably the greatest of fourth innings chasing wins. It stands second only to Bradman's 270 in the Wisden-100 list. I was privileged to watch every delivery of this classic.
5. MatchId: 1442 Year: 1999 India lost by 12 runs.
Pakistan:     238
India:        254
Pakistan:     286
India:        258 (Tendulkar 136)
Two low scoring first innings totals meant that India had a small lead of 16. Pakistan had a much better second innings and set India 271 runs to win. Shahid Afridi scored 141 out of this total. India were 6 for 2 when Tendulkar walked in. Soon India lost more wickets and were 82 for 5. That too against a potent attack of Wasim, Waqar and Saqlain. Everything seemed over. However Tendulkar and Mongia added 136 runs when Mongia played the wildest shot imaginable and departed.
By now Tendulkar's back spasm was getting worse and he tried an attacking stroke and was dismissed when 16 runs were still needed. The Indian tail batted like novices and lost the last three wickets for 4 runs. Tendulkar took the team to a 95% level but could not finish the job. This innings has a lot in common with Inzamam's innings and Lara's innings. It must be mentioned that the Pakistani tail and West Indian tail supported their respective senior batsmen in a much better manner.
6. MatchId: 1360 Year: 1997 Australia won by 2 wkts.
South Africa: 209
Australia:    108
South Africa: 168
Australia:    271 for 8 (Mark Waugh 116)
Yet again a case of two low first innings scores meant that South Africa took a first innings lead of 101 runs. Then McGrath, Warne and surprisingly Bevan dismissed South Africa for 168. Australia needed to score 270 for a win against a reasonable attack, led by Donald. They were 30 for 2 when Mark Waugh entered. Although he lost partners regularly, he played a master class of 116. Other than Elliott, he received scanty support.
The only blot was that Mark Waugh was dismissed at 258 (shades of Tendulkar at Chennai). However this was the Australian tail, made of sterner stuff. They added the required 13 runs and added value to Waugh's innings.
I could have easily added the Gilchrist match-winner against Pakistan during 1999. The only negative (okay, not the correct term, let me say diluting) factor was that Gilchrist and Langer supported each other very effectively.
7. MatchId: 1315 Year: 1995 Match drawn.
South Africa: 332
England:      200
South Africa: 346 for 9
England:      351 for 5 (Atherton 185*)
This was the ultimate defensive innings. There might have been better and longer defensive efforts in the earlier innings. However when we come to the last innings of the tests, this is at the pinnacle.
South Africa made a useful 332 in their first innings, and after securing a good first innings lead of 132, set England a winning target of 478 runs in a million overs. Atherton opened the innings and was there 11 hours and 165 overs later. He faced 492 balls in an amazing display of concentration, temperament, technical excellence and sheer guts. That too against a powerful attack led by Donald and Pollock. This innings stands comparison with similar efforts like Hanif, Gavaskar and Barrington.
8. MatchId: 0990 Year: 1984 West Indies won by 9 wkts.
England:      286
West Indies:  245
England:      300 for 9 decl
West Indies:  344 for 1 (Greenidge 214*)
While Astle's was the ultimate attacking innings, Greenidge's match winning 214 was the ultimate attacking and winning innings. Two middling first innings meant that England led by 41 runs. Then England declared at 300 for 9 very early on the fifth day, leaving West Indies to score 342 for a very unlikely win. England would have hoped to win comfortably with Willis, Botham and Foster in their ranks. What followed was straight off the "twilight zone".
Haynes got out soon. However Greenidge went on the attack. Gomes provided attacking support. Greenidge scored 214* in 242 balls and West Indies won by 9 wickets with nearly 15 overs to spare. They scored at over 5 runs per over and still had the fearsome duo of Richards and Lloyd padded on. Botham, who captured 8 wickets in the first innings, conceded nearly 6 runs per over in the second. The margin of victory and the resources yet available makes this one of the most incredible victories ever.
9. MatchId: 0854 Year: 1979 Match drawn.
England:      305
India:        202
England:      334 for 8
India:        429 for 8 (Gavaskar 221)
England took a first innings lead of 103 and then declared at 334 for 8 leaving India more than 150 overs to score the massive 438 to win. India finished day 4 comfortably placed at 76 for no loss. On the fifth day Chauhan helped add 213 with Gavaskar and then Vengsarkar added 150 with Gavaskar. India were 366 for 1 at one stage and the highest chase ever appeared still within grasp. Then Vengsarkar was dismissed. Kapil Dev came in and went.
The body blow was when Gavaskar was dismissed at 389. Then Viswanath and Yashpal left going for the win and India had to shut shop for the most honourable of draws. they fell 9 runs short. Gavaskar's effort matches his last Test innings of 96. Neither produced a win, but were jewels in his crown.
10. MatchId: 0498 Year: 1960 Match tied.
West Indies:  453
Australia:    505
West Indies:  284
Australia:    232 (Davidson 80)
Contrary to the rest of the matches presented herein, this match produced two huge first innings. First Sobers anchored West Indies to 453 with an attacking 132. Norman O'Neill responded with 181 and with very good support from other batsmen, Australia posted 505 for a first innings lead of 52. West Indies scored 284 leaving Australia to score 233 for a win.
Australia slumped to 92 for 6 and a West Indies win was on the cards especially as the bowling attack was Hall, Worrell, Sobers, Ramadhin and Valentine. Then the two all-rounders, Davidson and Benaud added 134 for the sixth wicket and Australia were coasting for a win. Davidson was unfortunately run out for a top-drawer innings of 80. Two more run outs followed and the first tie resulted. Davidson's 80 ensured a memorable result. Not to forget his other innings of 44 and 12 wickets in the match.
11. MatchId: 0320 Year: 1950 Australia won by 5 wkts.
South Africa: 311
Australia:     75
South Africa:  99
Australia:    336 for 5 (Harvey 151*)
This was a peculiar match. After a good South African first innings of over 300, there were two sub-100 innings with the spinners Tayfield and Johnson dominating the bat. Australia started the fourth inns needing to 336 to win and no one would have given them even 10% chance against Tayfield and Mann. They started poorly and Harvey walked in at 59 for 3. Then he produced his best innings for Australia with a 5 hour match winning knock of 151.
He was well-supported by Loxton and McCool. Tayfield and Mann bowled 100 overs between them and took only 5 wickets on a wearing pitch. Harvey dominated the bowling completely.
12. MatchId: 0088 Year: 1906 South Africa won by 1 wkt.
England:      184
South Africa:  91
England:      190
South Africa: 287 for 9 (A.D.Nourse 93*)
The first three innings were sub-200 efforts and the net result was that South Africa had to score 284 to win on a wearing pitch. They lost wickets steadily and only White stood firm. Their top batsmen, Sinclair and Faulkner departed and South Africa were 105 for 6 when Nourse walked in. He added 121 priceless runs with White and these two were well on the way to a win when White was out at 226. Vogler and Scwarz followed soon and South Africa were 239 for 9, staring at the barrel.
Nourse stood firm and with the support of Sherwell who scored 22, added 48 for the last wicket to win a memorable match by 1 wicket. The English attack was led by the deadly Blythe.
13. MatchId: 0074 Year: 1902 Jessop G.L 104 (England won by 1 wkt)
Australia:    324
England:      183
Australia:    121
England:      263 for 9 (Jessop 104)
This was the famous "We will get 'em in singles" match. This match is almost identical to the previous match in every manner. A big Australian first innings letting them get a substantial lead of 141 and then an Australian collapse for 121 leaving England to get 263 for a win. England tumbled to 48 for 5 when Jessop walked in. He played the only he could have. He attacked the bowling and added over 100 with Jackson. Then he himself fell at 187, having scored 104 out of the 139 added while at crease.
The innings lasted an hour and quarter and I estimate he faced no more than 50 to 60 deliveries. Jessop fell while still 76 runs short. however Hirst took over and orchestrated the win with a fluent 58, possibly uttering the famous words mentioned at the beginning.
Given below are some of the other innings which came to my attention and could easily have been included.
Sutcliffe      135 vs Aus (1929)
Headley        223 vs Eng (1930)
McCabe         189* vs Saf (1936)
Mitchell       189 vs Eng (1947)
Hazare         122 vs Win (1949)
Nurse          168 vs Nzl (1969)
Randall        174 vs Aus (1977)
Vengsarkar     146 vs Pak (1979)
Gavaskar        96 vs Pak (1987)
Miandad        102 vs Win (1988)
De Silva       143 vs Zim (1998)
Jayawardene    123 vs Saf (2006)
Smith          154 vs Eng (2008)
Shakib-al-Hasan 96 vs Win (2009)
Once more let me repeat my requests to readers.
Comment on these innings, by all means. However do not find fault with the list. These are my selections based on very strong objective criteria and some subjective inputs. Three months later my baker's dozen might look different.
Please send your own entries. However only entries where there is some insight into the innings will be published. You have to take the trouble of telling me (and the other readers) more than a number and a name.
