ODI wins: with oodles of resources to spare
An analysis of the biggest ODI wins batting first and chasing
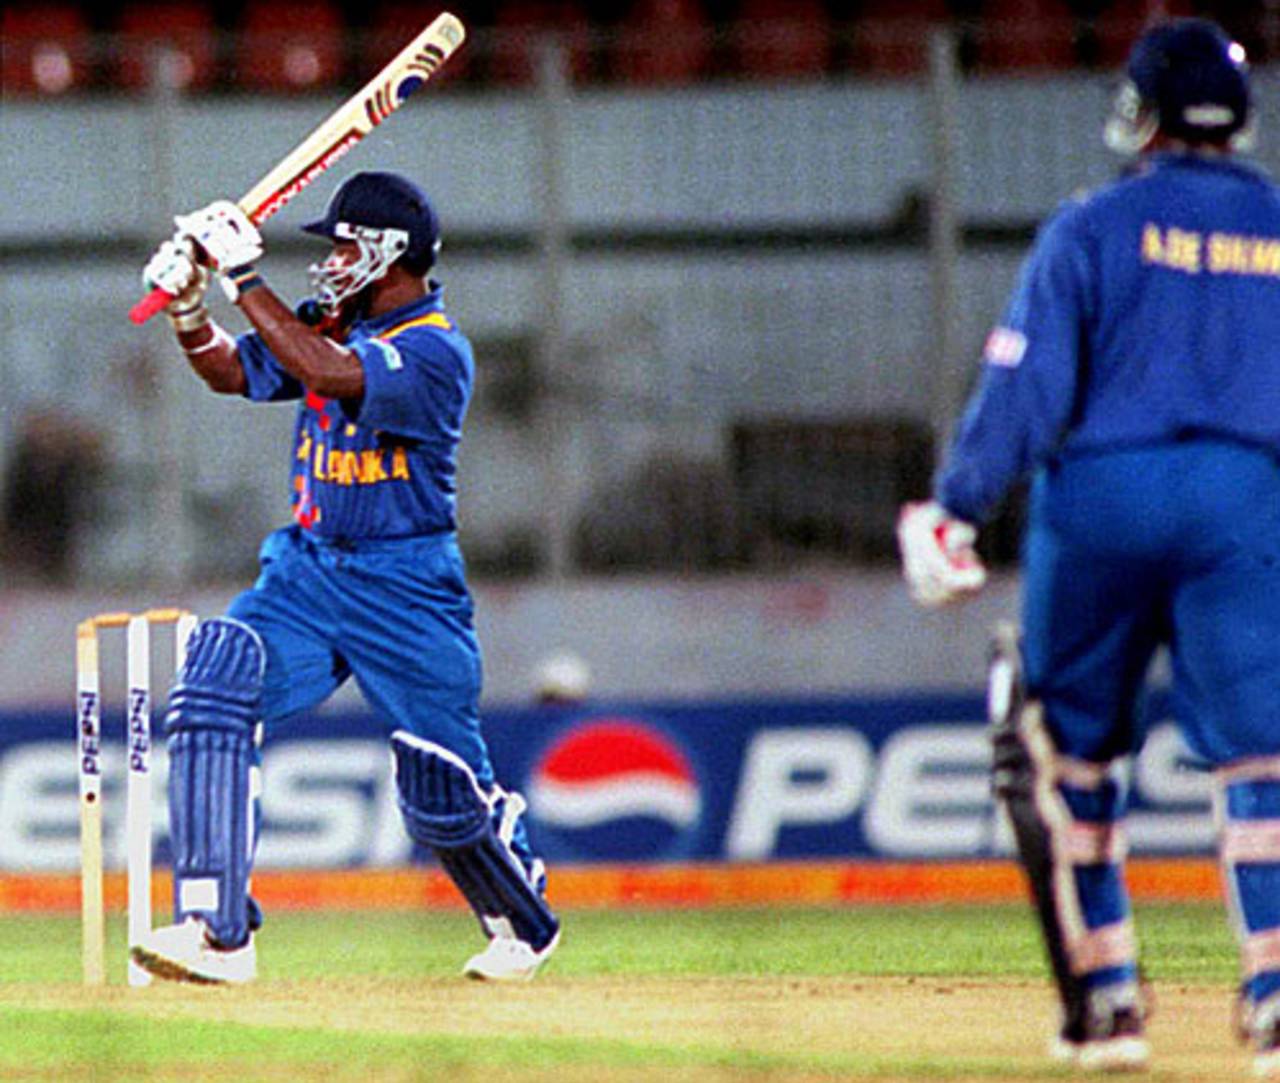
Sanath Jayasuriya: set up a 245 run win over India • Getty Images
First, something of interest to the readers. In one of my responses I had mentioned that I had just finished reading Lynne Truss's classic "Eats, shoots and leaves" and hoped that my apostrophes were correctly placed. This was like a fleeting peep into the unknown. Couple of readers mailed and asked me about the book. A nice diversion for me, I thought. Here we go.
Lynne Truss's book is an all-time classic on English punctuation and should be read by anyone who does anything in English. It is now availeble in a low-cost edition in India. Okay, what about the title.
A panda walks into a cafe. He orders a sandwich, eats it, then draws a gun and fires shots in the air. He then walks towards the exit.
The waiter is baffled and asks the panda "why ?". The panda produces a wildlife manual and asks the waiter to read the desription of himself, the panda.
Sure enough, there is an explanation.
"Panda: Large black-and-white bear-like animal, native to China. Eats, shoots and leaves."
The waiter understands.
To those of you who have not got it, the single comma, inserted unnecessarily between eats and shoots, changes the whole sentence on the panda's eating habits. It should have been "Eats shoots and leaves.", "shoots", of course, referring to bamboo shoots. No wonder, he protested.
Do not miss this classic on correct punctuation. It is a constant bed-side companion book for me.
At the beginning of last year I had looked at huge ODI wins, using scoring rates as the base. This represented the relative usage of resources in an indirect manner. In this article I have looked at wins achieved with least deployment of resources looking at the same directly.
Let us first look at the chasing wins which offer the clearest look at deployment of resources. Everything is cut and dried at the beginning of the chasing innings and we would be able to determine the availability of resources in a very accurate manner.
Let me say that a team is restricted to 99 in the first innings, it does not matter whether they were dismissed in the 31st over or scored 99 for 8 (as Bangladesh did way back) in 45 overs. The target in front of the chasing team is 100. They have two resources at their disposal, viz., 10 wickets and x balls (normally 300). This is fixed and set in stone, ignoring the matches where rains come in and the duo of dons from England take over. In most cases the resource situation remain clear.
In the first part of this article I am going to look at the wins in which the winning teams expended the minimum of these resources and won by a few miles, so to speak.
First, the balls available. There may be Power play options, fielding restrictions in force, ball changes et al. However it is safe to conclude that the balls resource can be measured in a linear manner. With the advent of two optional Power Plays, no one can say that the middle overs are low-scoring overs. The batting team can take the PP at any time to compensate for a low-scoring period, although the captains rarely do so. Hence I will take the balls resource in a linear manner. If the maximum balls is 300 and 210 balls are available, 30% of this resource has been used. If 120 balls are available, 60% has been used and so on.
The wickets resource is slightly tricky. Not all wickets are equal. Certainly the top order wickets are more valuable than the low order wickets. There are two ways of doing this. The first is a simpler but very good method. I assign the following weights for the wickets. Not subjectively done, but by an informed allocation.
Wickets 1 to 6: 12.5% - 75%
Wicket  7:      10.0% - 85%
Wicket  8:       7.5% - 92.5%
Wicket  9:       5.0% - 97.5%
Wicket 10:       2.5% - 100%
If 4 wickets are lost, 50% of wicket resource has been used, if 7 wickets are lost, 85% of the wicket resource has been used and so on. It works very well. The only point of contention might be the argument that at the fall of 6th wicket we might still have a pair of very good batsman batting. But the weight is a fair 10% for the seventh wicket and Gilchrists and Dhonis, batting at 7, do not abound in plenty.
The second is to do a more accurate weighting of wicket values. I add the ODI Index (Batting average x Strike rate) values for all 11 batsmen. This represents the total available resource. I then determine the sum of ODI Index for the dismissed batsmen. This represents the already deployed resource. The ratio between the two gives us the required value. If Tendulkar and Vijay open, and one of them is out in a 9-wkt win, the resource available will vary significantly depending on which one is out. Of course for 10-wkt wins, the two methods lead to the same result.
I have done the calculations on both methods. My personal take is that the simpler method is sufficient and works well in 95% of the situations. The two resources carry equal weights. There might be situations where one might be more valuable than the other. Bot there is no clear way in which this sort of variable weight can be determined.
Let us now look at the tables. First, the one based on a simple wicket weight.
Wicket resource calculation: Method 2 - Simple wkt weight based
It is obvious that a 10-wicket win would lead the table. However it is also essential that no balls were wasted and the win was reached post-haste. That is what New Zealand did against Bangladesh. They chased a target of 94 runs in 6 overs, at a scoring rate exceeding 15 and did this without losing a wicket. I have already talked about this match in my article on McCullum. This is the most devastating chasing win in ODI history. The next two blitzkriegs were by Sri Lanka who dismissed their opponents for sub-40 totals and then proceeded to win in below 5 overs, both times for the loss of one wicket. If either of these wins had been for no loss of a wicket, the resources available would have been 95%+. Then come India 10-wkt win over Kenya and South Africa's 10-wicket win over Bangladesh.
However, from point of significant win over a good opposition, the next two losses by England are the ones to turn to. In the first case England were dismissed for 117 and then Australia blasted to 118 for no loss in a mere 12 overs. England were dismissed for 88 and Sri Lanka overhauled this for no loss in fewer than 14 overs. Pakistan also lost by 10 wickets in 14 overs to South Africa.
To view/down-load the complete table, containing wins with reserves exceeding 50%, please click/right-click here.
Wicket resource calculation: Method 1 - ODI Index based
This is based on the ODI Index and has a slight variation to the previous table. The 10-wicket wins retain the same values as in the first table. The resource-left values for other wins depends on the quality of wicket(s) lost. Note the difference in the two Sri Lankan 9-wicket wins. In one case it was Avishka Gunawardene whose wicket was lost. In the other case, the more valuable wicket of Jayasuriya which was lost.
To view/down-load the complete table, containing wins with reserves exceeding 50%, please click/right-click here.
To complete the exercise, I have also presented here the table of huge wins, this time by teams batting first. Before any reader rushes in, let me say that these two are apples and oranges or more aptly mangos and kiwi fruits. The resources are used in totally different ways. The first batting team uses all available balls resource (again rain-d-l situations excluded) and a significant proportion of the wickets resource. The second batting team is dismissed for a low total and the win is by runs and the win margin reflects the size of win. I have ordered these wins by the ratio of second innings score to the first innings score. This clearly reflects the dominance, rather than the run margins. Let us now look at the tables.
MtId Year FBt Score SBt Score Result % score
Australia's 256-run demolition of Namibia (who ???) leads this table since Namibia scored only 15% of the Australian total. However this match must be discounted since Namibia could have been beaten by half of the state sides of South Africa, England, Australia or India. The miracle was how they restricted Australia to only 301.
The real match of significance, in this regard, was Sri Lanka's 245-run blitz of a near-full-strength Indian team. Jayasuriya, Vaas and Muralitharan made India look like a collection of novices. India scored less than Russell Arnold. In fact I have done some detailed performance analyses for a company and this Sri Lankan performance has come out to be the greatest team performance ever. Everything has to click, the bowling and batting, that too against a top side.
The next three wins by South Africa, West Indies, Sri Lanka (recently) were all against good opponents and rank only slightly below the Sri Lankan win. A feature of this table is the proliferation of top teams at the top of the tables which have lost. This indicates that it is more likely that a good team has a bad day chasing a big total. In the first collection, it was mostly the minnows who were at the receiving end.
I am amazed at the frequency with which Sri Lanka has inflicted heavy defeats. Maybe the Murali factor.
To view/down-load the complete table, containing wins with margins exceeding 50%, please click/right-click here.
Let me re-iterate to the readers that I have not compared the numbers in these two different types of wins. Each stands by itself.
Anantha Narayanan has written for ESPNcricinfo and CastrolCricket and worked with a number of companies on their cricket performance ratings-related systems