Anantha Narayanan
A look at the best players of the decade, in purely numerical terms
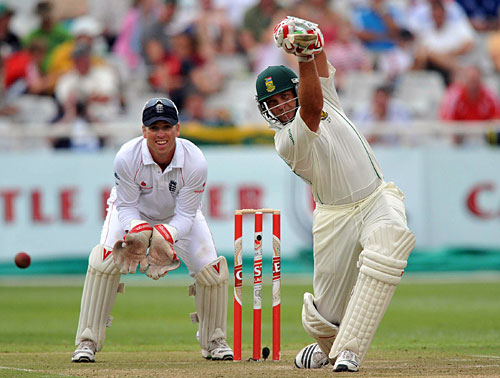
|
| Jacques Kallis is on top of this list, pipping Ricky Ponting to second place © Getty Images |
I have decided to do a pure numbers-based analysis of the decade from all relevant angles and come with my own list of the top players. This is not to find any holes in the Cricinfo list but to study along with it. Let me say that I have not been asked by Cricinfo to do this and this is on my own initiative.
A typical paragraph in the said article might have run.
"He scored ****** Test runs at a high average of **.**. More than half these runs were scored away. In ODIs his compilation was ****** runs at a middling average of **.** and an outstanding strike rate of ***.*. In addition he picked up a total of *** international wickets at averages way below the average for the decade. His fielding was brilliant and he took *** catches. His team had a better than **% winning record in both Tests and ODIs. He led his team through player change phases very effectively".
Or parts of this paragraph for different players. I have made all efforts to translate each of these "*****"s to measurable and rateable numbers.
Some guidelines.
1. Tests and ODIs will get equal weight (50%/50%). I do not think many would have complaints with this. T20 will not be considered since only around 100 matches have been played.
2. Batting and Bowling will get equal weight (35%/35%). This also should not bother anyone other than those who would oppose this in order to push up their favourite players. However I have always felt that the Bowlers get a raw deal and I will not be a party to that.
3. For key factors such as Runs scored and Wickets captured I will use the unadjusted figures since we are only considering the past 10 years and there have not been many variations during this period.
4. For batting and bowling performance measurements, I will only use the standard accepted measures such as Average, Strike rate, RpO et al. I will not use any derived measures. This makes sense.
5. Fielding, in the form of catches and stumpings, will carry some weight (5%/5%). Oh I know this will benefit the wicket-keepers. I am quite comfortable with that especially as that is the most difficult task on the field.
6. Wins will carry some weight (4%/3%). I know this will elicit complaints from supporters of players whose teams have not performed well. However winning is the most important part of any sport and we have to recognize that.
7. Some weight will be given to captaincy (3%/3%), only in the form of number of matches captained since the previous point would have taken into account the results. The captain clearly shoulders a major additional responsibility in addition to the batting, bowling and wicket-keeping tasks and this factor has to be recognized.
8. For ODIs some weight will be given to success in the major events such as World Cups and ICC Cups (3%). 2 World Cups and 5 ICC Cups were held during this period. After all these are Blue Ribbon events and merit special recognition.
9. Since I will not be taking in the match level performances, I will give some weight (3%/2%) for the number of Man of the Match awards secured. This may not be perfect but is a clear indicator to the contributions by the players towards achieving wins.
10. The period 2000-2009 will be implemented strictly irrespective of mid-series positions.
11. Other than the common-sense based points weight, this will be a completely objective analysis based on known irrefutable facts and no assumptions or derivations.
12. This is an analysis of what was achieved during the decade. Injuries, non-selections, boycotts, home country problems, opt-outs, ICC bans (ICL???), backstage manipulations et al have no relevance here. If I have to make allowance for Tendulkar's injury during early 2000s, I also have to make allowance for the enforced absence of the talented Pakistani players over the past few years. No, those doors are closed. It is what was achieved on the field during the decade which will count.
13. For the purposes of this analysis I have fixed the minimum criteria as either 5000 international (Test+ODI) runs or 200 international wickets. 82 players quailfy. Anyone who misses these numbers is unlikely to be even in the peripheral vision of any jury.
At no stage should the readers forget that the purpose is to find out the Player of the decade, based on all relevant factors, including batting, bowling, fielding, captaincy responsibilities, team performances, successes et al. These are Batting or Bowling analyses.
Let us view the table now. The Players of the decade table is presented bwloe.
No RtgPts  Player                Test     ODI  Cricinfo
Position
1. 57.22  Kallis J.H           31.42   25.80     2
2. 52.18  Ponting R.T          27.21   24.97     1
3. 48.45  Pollock S.M          22.24   26.21
4. 47.62  Muralitharan M       24.84   22.78     4
5. 46.25  Jayasuriya S.T       19.16   27.09
6. 44.69  Tendulkar S.R        19.93   24.75     6
7. 44.27  Gilchrist A.C        21.07   23.20     3
8. 42.83  Gayle C.H            18.23   24.60
9. 41.00  Flintoff A           19.54   21.46
10. 40.31  Lee B                17.53   22.78
11. 40.02  Sehwag V             18.91   21.11
12. 39.97  Vettori D.L          19.87   20.10
13. 39.94  Sangakkara K.C       20.91   19.03
14. 39.78  Jayawardene D.P.M.D  21.80   17.98
15. 39.18  Dravid R             21.73   17.44     9
16. 38.96  McGrath G.D          18.65   20.31     5
17. 37.72  Ganguly S.C          15.33   22.39
18. 37.70  Hayden M.L           21.83   15.87
19. 37.69  Vaas WPUJC           18.03   19.67
20. 37.15  Smith G.C            20.66   16.49
21. 36.58  Warne S.K            22.93   13.65     7
22. 34.72  Harbhajan Singh      16.86   17.87
23. 34.52  Ntini M              17.35   17.16
24. 33.59  Mohammad Yousuf      17.54   16.05
25. 33.45  Clarke M.J           13.42   20.03
- 16490 runs / 399 wickets / 201 ct-st / 209 wins / 34 MOMs / 13 captaincies.
Ricky Ponting has his team successes supporting him and he deserves his second place. Not to forget his own personal contributions towards achieving these wins. He could very well have been on top.
- 18561 runs / 3 wickets / 239 ct-st / 301 wins / 2 WC + 2 ICC wins / 36 MOMs / 318 captaincies.
There is a surprise at the third position. Shaun Pollock shows that he is one of the under-rated all-rounders. The averages and rpo figures are amongst the best of this decade.
- 4731 runs / 535 wickets / 135 ct-st / 181 wins / 23 MOMs / 142 captaincies.
Muralitharan with his tally of 898 wickets is in fourth position. Jayasuriya is in a deserved fifth position with 12527 runs and 205 wickets. Gilchrist with 12373 runs and 759 ct/st dismissals follows. The summary of formulae used. Given below are numbers to get maximum wt values for Tests/ODIs.
Runs:     10000/10000
Wkts:     600/400
BatAvge:  60/60
BowAvge:  20/20
Ct/St:    400/400
Wins:     150/200
Capts:    150/200
MOMs:     16/30
ODI S/R:  1.25 for max
ODI Rpo:  3.0 for max.
To download the complete set of tables, please right-click here and save the file.
I am sure when the esteemed jury voted they took into consideration the non-numerical factors. That would have been the correct thing to do. As such, Ponting, with the type of team building he has done on the field could be comfortably placed at the top. The impact Muralitharan has on Sri Lankan cricket would have propelled him into the third position and the same with Gilchrist, even after retirement. Nothing needs to be said about the colossus, Tendulkar. His mid-table position is certainly justified.
Now it becomes a bit murky. The ignorance of Jayasuriya and Shaun Pollock by the jury is baffling. Until 6 months back Jayasuriya has been magical on the field. Shaun Pollock is as good an all-rounder as Kallis. Kallis might be ahead by a mile in batting but Pollock is in front by three-fourths of a mile in bowling. His accuracy in ODI cricket is legendary. Gayle's continued poor performances under Lara's captaincy might have counted against him. Also he did not have a great test decade. Flintoff was injured too often to be under serious consideration. Brett Lee was also a better ODI bowler than in Tests.
As far as Lara is concerned, he was forced into a hurried retirement by the non-Trinadian-clique at the end of the World Cup, when he had couple of years of top-level Test cricket ahead of him. He still had a pretty good Test decade but his ODI performances during the decade were quite indifferent and I am surprised that one juror even voted him at the top.
Overall I would say the jury did an excellent job. The numbers analysis supports them quite strongly. For once a committee approach has worked very well.
My 1-2-3 ??? Kallis, Ponting, Tendulkar/Muralitharan. Did I hear someone say, only 3. Tough luck, it is my selection. And if you add Gilchrist & McGrath, two of my favourite cricketers, we have the Cricinfo top-6.
Based on Alex Tierno's excellent suggestion I had worked on Batting Power Factor; now I have worked on a similar power factor for bowling, with inputs from Anshu Jain.
Based on Alex Tierno's excellent suggestion I had worked on Batting Power Factor - a simple measure to determine the most destructive ODI innings through simple, easy-to-create methodologies. The article was well-received because of the simplicity of the idea. My thanks to Alex.
It follows logically that I should create a similar Power Factor for bowling. I had asked for suggestions. The simplest and most effective suggestion, closest to what I myself was thinking, came from Anshu Jain. My thanks to Anshu.
The requirements are set out below.
1. The methodology should be easy to understand and easy to work out. I have been influenced by Sattvir who mentioned that he wanted to calculate the IPF for each innings as he watches TV. There should be no need to go to the net to get the batsman average or bowler strike rate or whetever. Everything should be available from the Scorecard. A calculator might be needed.
2. The first factor to be recognized is the number of wickets captured. This is the most signicant of a bowler's contributions in a match. It should be recognized that in a 10 over spell, capturing more number of wickets is progressively more difficult. Unlike batting where a batsman can play 150 balls and score 200 runs, here the bowler achieves all in a spell limited to 20% of team overs.
3. The batting position of wickets captured is also important. Not necessarily the batting average.
4. Bowling accuracy is important but only in relation to the team numbers. By itself the bowling accuracy figure means very little as explained below.
India: 150/50 overs (Lee 10-2-25-2,Johnson 10-1-40-2,Watson 10-1-35-1)
India: 250/50 overs (Lee 10-0-45-2,Johnson 10-1-40-2,Watson 10-0-55-1)
Johnson has identical analysis in both matches. However his bowling in the first match is below-par and in the second batch is above-par. Lee has been above-par in both matches and Watson is below-par in both matches.
So the Bowling Accuracy index will be determined based on the bowler's numbers as well as the team's numbers.
I considered briefly and discarded the "% of team wickets" measure since good 4 and 3 wicket performances, where the "% of team wickets" figure was 100, moved up drastically in an unjustifiable manner. This is quite unlike the "% of team score" measure which moves in a 10%-20% band.
Methodology used:
The base is the wicket points. The following are the points allotted. There is a progressive increase for each wicket.
1   2   3   4   5   6   7   8
7  15  25  37  50  64  80  100
To determine the wicket quality, batting position is determined rather than batting average. Anyhow the best batsmen normally bat within no.4. Also if Ponting bats at no.10 his wicket is nowhere as important as at no.4. If a team is reduced to nothing for 3 or 4, it is normally quite difficult to recover. The bowler who captures top order wickets is rewarded and the bowler who captures low order wickets is penalized. This is based on the following formula.
Wickets 1 -  4: 2.0 points
Wickets 5 -  6: 1.5 points
Wickets 7 -  8: 0.75 points
Wickets 9 - 11: 0.25 points
The total for all wickets is added and divided by the number of wickets to arrive at the Wicket Quality Index value. The highest value for WQI is 2.0 (the bowler all whose wickets are 1-4) and the lowest value for WQI is 0.25 (the bowler all whose wickets are 9-11).
The Bowling Accuracy Index is determined by dividing the "Other bowlers' RpO" by the Bowler RpO. The highest ratio value for relevant spells is 10.16 (Walsh's 5 for 1 against SLK). In fact in 3882 such spells only 10 values are above 4 and represent completely bizarre situations, as perfectly illustrated by the Walsh spell. Hence these ratios are first capped at 4.0 and then the square root taken to arrive at the BAI. The index maximum is thus 2.0. This halving is to enure that for a bowler to get a par factor of 1.0, he has to perform at a level twice that of the team. Also to ensure parity with the WQI values. The highest value for BAI is 2.0 and the lowest value for BAI is 0.23.
Now the BPF is determined by multiplying the WP (Wicket Points) by WQI and BAI.
Let us look at the table and the top-20 performances. Only bowlers who captured 3 or more wickets are considered.
No Bowler MtNo For Vs Analysis WktPts WQI BAI BPF
The seven wicket spells of Bichel and McGrath are in the next two positions. Bichel captured wickets 2-8. McGrath's spell included 6 of the top-5. Also note the bowling accuracy of both these spells.
D T Johnston took 5 of the top-6 wickets. Every one knows what Mendis did against India in the Asia Cup Final. He took 3 of the top-6 wickets.
Muralitharan's 5-wkt haul, all in the top-6, coupled with a bowling accuracy which is better than his team's figures by more than 4 times has propelled his performance to the top-5. Imran Khan's 6-14 demolition of India is next, followed by Bond's 6-23 against Australia.
Vaas's best ever ODI bowling effort of 8 for 19 is next. He would have captured all 10 wickets but for the introduction of Muralitharan. Joshi's 5 wickets were in the top-8 and he had an RpO figure of 0.6, way below his team's. This takes him to tenth place.
Note the high placement of Simmons' 4 for 3 against Pakistan. Aaqib Javed's 7 for 30 against India is in 14th position since the bowling accuracy just about matched the rest of the bowlers. Waqar Younis' 7 for 36 finds its way into the top-20.
To view/download the complete 3-wkt bowler list, limited to BPF of 50.0 points and above, please click/right-click here and save the file.
I have created an alternative version of the table based on the suggestion of Unnikrishnan in that I have used the Batting quality total points as it is, without dividing by the number of wickets. This has then been multiplued by the BAI value. The points for the 4 batting groups are 10(1-4), 7(5-6), 3(7-8) and 1(9-11) to get a reasonable final number. To view/download the revised 3-wkt bowler list, limited to BPF of 30.0 points (not comparable to the main table) and above, please click/right-click here and save the file.
I am happy that Gilmour stays on top. A few 7-wkt hauls have been pushed down and great 4-5 wkt spells have moved up because the differential values of the base points has been taken out of the equation.
Finally the analysis many of you have asked and been waiting for patiently - a look at the best players in both forms of the game in the last 40 years
First, the "Twelve Commandments" followed in doing the analysis.
1. Equal weight for Tests and ODI. T20 internationals not included since many top players have not played any T20-I matches and anyhow very few matches have been played. Let the number of T20-I matches cross 1000 before we consider it worthy of inclusion in this type of analysis.
3. Especially for ODI, recognise and incorporate the important fact that during the early 20 years very few ODI matches were played.
4. While evaluating batting average related measure for ODIs, work out an equitable method which is fair to the top order who can build long innings but get dismissed often and late order batsmen who do not have time to build long innings but remain unbeaten more often.
5. Recognise the fact that runs scored against stronger teams should carry additional weight as compared to runs scored against lesser attacks.
6. Recognize how the batsman has performed in comparisons to his peers.
7. Use only career level figures. Match performances, while very relevant would make it difficult to be equitable to Tests and ODIs.
8. Since this analysis is limited to batsmen who played between 1969 and 2009, work out the algorithms based on these years. In other words, keep out of the equation Bradman's outrageous figures. An average of 60.00 is the pinnacle, not halfway down the pole. This has helped to rationalise the analysis quite well.
9. Since this is a pure batsman-based analysis, exclude the non-batting factors such as Captaincy, Results, World Cup wins, Wicketkeeping load etc. Richards and Ponting might have won more matches and World Cups than Tendulkar and Lara but that should not be used to decide who is ahead in this batting analysis.
10. I also decided that I would sum the points at rounded integer level and would tie batsmen who have similar points. I would not use decimal points to separate any groups.
11. The Balls played information is available for Test players with 100% certainty only for the past 15 years. After a long deliberation I decided not to use this since it would mean I would have to extrapolate this based on team balls played for over 25 years of Test matches. That would not have been fair to the earlier batsmen, especially the attacking ones.
12. Finally I thought long and hard and decided not to use the IPF, the new ODI measure suggested by Alex Tierno. The main reason for this is that this is primarily an innings-level performance measure. The secondary reason is that this is a derived measure, not a basic one.
As usual there has to be a minimum criteria. I have decided on 2000 Test runs and 1977 ODI runs (so that Clive Lloyd is included). I am not going to do a batsman analysis which keeps Lloyd out but Vaas/Akram in. 116 players qualify and this is quite a substantial sample size. No Test player of note misses out. The only one who comes to mind is Shahid Afridi, who is one of the ODI greats but has scored only 1683 Test runs, and is unlikely to add more.
The following are the points allotted for different measures.
Tests:  Runs scored     - 100
Adjusted runs   -  50 (adjusted for matches played during career)
Batting average - 200
% of Team score -  50
Bowling quality -  50 (weighted by runs scored)
Peer comparison -  50 (batting average comparison)
The average number of ODIs per year played by Pakistan during 39 years is 19.7. The average number of ODIs played by Pakistan during Zaheer Abbas's career is 8.00. The runs scored by Zaheer Abbas are multiplied by a factor 2.46 (19.7/8.0) and points allotted for this measure. For Mohammad Yousuf, his career span number for Pakistan is 29.4 and the multiplying factor is 0.67 (19.7/29.4). Thus this redresses the wide imbalance which exists in the number of matches, especially ODIs, played over the years.
Note that the country figures rather than individual player figures are used since the player might not play due to injuries or non-selection. Note also that the base country is used as the base for doing this calculation for the player. Since the number of matches played by various countries varies by a factor of 2.5 to 1, comparisons with a single across-countries base would go haywire.
This is also done for Tests although the variations are far less for Tests.
For Tests, additional credit is given for away averages as compared to overall batting averages. Also away runs scored carry additional weight. The peer comparison is only on batting average.
For ODIs, a measure in between the Batting average and Runs per innings is determined, based on the number of innings and not outs and then the weighting points arrived at. Independent peer comparisons are done on both batting average and strike rate.
For both Tests and ODIs, the bowling quality is used by summing the product of "innings runs scored" and "average of other team bowling average" and dividing the "sum for all innings" by the "career runs scored". A very effective manner of doing this as proved by the fact that Gooch, who faced the formidable West Indian and Australian attacks, has a Test bowling quality figure of 31.98 (index value of 42.1), while Atapattu who has scored tons of runs against the weaker attacks has a bowling quality figure of 40.55 (index value of 10.0).
Now let me unveil the tables. These tables are current upto Test # 1944, which produced the unlikeliest of wins essayed by a resurgent and dynamic England side against a flat and insipid South Africa.
The best batsmen across formats - across years
Test   ODI   Test    ODI
Runs  Runs    Pts    Pts
500    500
This is a continuation of my previous article, which was on the same 11 players who'd played the most Tests
Ananth in future when you have some time you can consider analysing number of Test matches a group of players in a team have played together...Min 2 to Max 11.
Updated till Test# 1944 (South Africa - England : Dec 26 2009)
Number of players together : 3
This one is based on a request by one of the readers - a look at the number of Tests in which a specific set of 11 players played together for a team
I have reproduced below Sesha's specific request.
Ananth in future when you have some time you can consider analysing number of Test matches a group of players in a team have played together...Min 2 to Max 11 :-)
That is a single statement which has multiple analysis of different shades built in. I have done the first one out of these. Let me say that this was one of the toughest bits of analytical work I have ever done. The details would be of interest to some of the readers and I have created a separate document which can be viewed by clicking on the link provided at the end.
The first analysis I have done is to find out the maximum number of Tests played by the same eleven players. A real tough analysis but well worth the effort since it provides us many insights to the teams, their selection methodology and players' fitness.
Readers must remember that the emphasis is on Tests, not series. Also the playing order is not relevant. Let me warn the readers that they would be surprised with the numbers shown.
West Indies leads the list with 11 Tests in which the same 11 players played. This was at their heyday. These 11 Tests were played, not necessarily in close proximity, over a three-year period between 1988 and 1991. The eleven players were
Greenidge, Haynes, Richards, Richardson, Hooper, Logie, Dujon, Marshall, Ambrose, Walsh, Patterson.
The Tests are shown below.
1098 1988 Win-Eng Draw
1099 1988 Win-Eng Win
1108 1988 Win-Aus Win
1110 1988 Win-Aus Win
1112 1988 Win-Aus Win
1114 1989 Win-Aus Draw
1166 1991 Win-Aus Draw
1167 1991 Win-Aus Win
1168 1991 Win-Aus Draw
1169 1991 Win-Aus Win
1170 1991 Win-Aus Loss
This was one strong team, one of the strongest of all time. The interesting thing is that Lara made his debut in match #1158 smack in the middle of this run and was then not played for a few Tests. For quite a few Tests in the middle Ian Bishop and Benjamin played. The surprising fact is that this strong West Indian team fared in a below-average manner during these 11 Tests, only winning 6, drawing 4 and losing 1.
Australia is next in the list with 9 Tests in which the same 11 players played. This was at their heyday. These 9 Tests were played over a 15-month period. The eleven players were
Hayden, Langer, Ponting, M Waugh, S Waugh, Martyn, Gilchrist, Lee, Warne, Gillespie, McGrath.
The tests are shown below.
1558 2001 Aus-Eng Win
1565 2001 Aus-Nzl Draw
1571 2001 Aus-Nzl Draw
1573 2001 Aus-Nzl Draw
1576 2001 Aus-Saf Win
1590 2002 Aus-Saf Win
1593 2002 Aus-Saf Win
1595 2002 Aus-Saf Loss
1615 2002 Aus-Pak Win
This was again a strong team, among the strongest of all time. In between, for two Tests, MacGill and Bichel played. The irony was that even this Australian team also fared in a below-average manner during these 9 Tests, only winning 5, drawing 3 and losing 1.
There are three teams which come in next, having 11 players in 6 Test matches each. I have only given the summary information to keep the article length to a reasonable one. It will be of interest to readers that two of these occurences have been during the past year, indicating the settled nature of the South African and English teams.
Smith, McKenzie, Amla, Kallis, Prince, de Villiers, Boucher, M Morkel, Harris, Steyn, Ntini.
South Africa: 2008 (3 wins, 2 draws, 1 loss)
1870 2008 Saf-Ind Draw
1871 2008 Saf-Ind Win
1873 2008 Saf-Ind Loss
1880 2008 Saf-Eng Draw
1881 2008 Saf-Eng Win
1893 2008 Saf-Bng Win
Tancred, Shalders, White, AD Nourse, Hathorn, Faulkner, Snooke, Sinclair, Schwarz, Sherwell, Vogler.
South Africa: 1906-07 (4 wins, 2 losses)
0088 1906 Saf-Eng Win
0089 1906 Saf-Eng Win
0090 1906 Saf-Eng Win
0091 1906 Saf-Eng Loss
0092 1906 Saf-Eng Win
0094 1907 Saf-Eng Loss
Strauss, Cook, Vaughan, Pietersen, Bell, Collingwood, Ambrose, Broad, Sidebottom, Abderson, Panesar.
England: 2008 (4 wins, 1 draw, 1 loss)
1867 2008 Eng-Nzl Win
1868 2008 Eng-Nzl Win
1874 2008 Eng-Nzl Draw
1876 2008 Eng-Nzl Win
1878 2008 Eng-Nzl Win
1880 2008 Eng-Saf Draw
India has had two separate teams of 11 players playing 4 Tests each. Both data sets are given below. Kapil Dev has been an integral part of both sets, although these have been 14 years apart. India has has quite a few 3-match sets of eleven players, twice under Ganguly and once under Dhoni. The main problem has been that the batsmen have had a steady presence. However the bowling combinations have been many. The permutations of spin annd pace bowler combinations have precluded playing the same side for long.
Prabhakar, Sidhu, Kambli, Tendulkar, Azharuddin, Amre, Kapil Dev, More, Kumble, Chauhan, Raju.
India: 1993
1211 1993 Ind-Eng Win
1213 1993 Ind-Eng Win
1214 1993 Ind-Eng Win
1229 1993 Ind-Slk Draw
Gavaskar, Chauhan, Vengsarkar, Viswanath, Yashpal Sharma, Kapil Dev, Kirmani, Binny, Ghavri, S Yadav, Doshi.
India: 1979
0861 1979 Ind-Pak Draw
0863 1979 Ind-Pak Draw
0865 1979 Ind-Pak Win
0866 1979 Ind-Pak Draw
Pakistan has had 6 different sets of eleven players who have played in 3 Tests together. The most recent is shown. Their opening combinations would have split up many a eleven.
Mohd Hafeez, Imran Farhat, Younis Khan, Mohd Yousuf, Inzamam-ul-haq, Shoaib Malik,
Abdul Razzaq, Kamran Akmal, Shahid Nazir, Umar Gul, Kaneria.
Pakistan: 2006
1815 2006 Pak-Win Win
1816 2006 Pak-Win Draw
1818 2006 Pak-Win Win
New Zealand has had 3 different sets of eleven players who have played in 3 Tests together. The most recent is shown.
Franklin, Wright, Jones, M Crowe, Greatbatch, Rutherford, RJ Hadlee, Bracewell, IDS Smith, Snedden, Morrison.
New Zealand: 1990
1136 1990 Nzl-Ind Win
1138 1990 Nzl-Ind Draw
1146 1990 Nzl-Eng Draw
Sri Lanka has had only one set of 11 players who have played in 3 Tests together.
Atapattu, Jayasuriya, Sangakkara, M Jayawardene, Tillekaratne, Samaraweera,
Arnold, Vaas, Fernando, Zoysa, Muralitharan.
Sri Lanka: 2001-02
1581 2001 Slk-Zim Win
1583 2002 Slk-Zim Win
1592 2002 Slk-Pak Win
Zimbabwe has had 5 sets of 11 players who have played in 2 Tests together. Bangladesh has had 3 sets of 11 players who have played in 2 Tests together.
To view an interesting note on the technical complexities in doing this analysis please, please click here. You might have to download/save and view.
At a future date I will do an analysis of lower number of players who have played together, starting with 2 players. That again is a tough analysis and requires different algorithms for each analysis.