The best batsman, across years and formats
Finally the analysis many of you have asked and been waiting for patiently - a look at the best players in both forms of the game in the last 40 years
AFP
First, the "Twelve Commandments" followed in doing the analysis.
1. Equal weight for Tests and ODI. T20 internationals not included since many top players have not played any T20-I matches and anyhow very few matches have been played. Let the number of T20-I matches cross 1000 before we consider it worthy of inclusion in this type of analysis.
3. Especially for ODI, recognise and incorporate the important fact that during the early 20 years very few ODI matches were played.
4. While evaluating batting average related measure for ODIs, work out an equitable method which is fair to the top order who can build long innings but get dismissed often and late order batsmen who do not have time to build long innings but remain unbeaten more often.
5. Recognise the fact that runs scored against stronger teams should carry additional weight as compared to runs scored against lesser attacks.
6. Recognize how the batsman has performed in comparisons to his peers.
7. Use only career level figures. Match performances, while very relevant would make it difficult to be equitable to Tests and ODIs.
8. Since this analysis is limited to batsmen who played between 1969 and 2009, work out the algorithms based on these years. In other words, keep out of the equation Bradman's outrageous figures. An average of 60.00 is the pinnacle, not halfway down the pole. This has helped to rationalise the analysis quite well.
9. Since this is a pure batsman-based analysis, exclude the non-batting factors such as Captaincy, Results, World Cup wins, Wicketkeeping load etc. Richards and Ponting might have won more matches and World Cups than Tendulkar and Lara but that should not be used to decide who is ahead in this batting analysis.
10. I also decided that I would sum the points at rounded integer level and would tie batsmen who have similar points. I would not use decimal points to separate any groups.
11. The Balls played information is available for Test players with 100% certainty only for the past 15 years. After a long deliberation I decided not to use this since it would mean I would have to extrapolate this based on team balls played for over 25 years of Test matches. That would not have been fair to the earlier batsmen, especially the attacking ones.
12. Finally I thought long and hard and decided not to use the IPF, the new ODI measure suggested by Alex Tierno. The main reason for this is that this is primarily an innings-level performance measure. The secondary reason is that this is a derived measure, not a basic one.
As usual there has to be a minimum criteria. I have decided on 2000 Test runs and 1977 ODI runs (so that Clive Lloyd is included). I am not going to do a batsman analysis which keeps Lloyd out but Vaas/Akram in. 116 players qualify and this is quite a substantial sample size. No Test player of note misses out. The only one who comes to mind is Shahid Afridi, who is one of the ODI greats but has scored only 1683 Test runs, and is unlikely to add more.
The following are the points allotted for different measures.
Tests:  Runs scored     - 100
Adjusted runs   -  50 (adjusted for matches played during career)
Batting average - 200
% of Team score -  50
Bowling quality -  50 (weighted by runs scored)
Peer comparison -  50 (batting average comparison)
The average number of ODIs per year played by Pakistan during 39 years is 19.7. The average number of ODIs played by Pakistan during Zaheer Abbas's career is 8.00. The runs scored by Zaheer Abbas are multiplied by a factor 2.46 (19.7/8.0) and points allotted for this measure. For Mohammad Yousuf, his career span number for Pakistan is 29.4 and the multiplying factor is 0.67 (19.7/29.4). Thus this redresses the wide imbalance which exists in the number of matches, especially ODIs, played over the years.
Note that the country figures rather than individual player figures are used since the player might not play due to injuries or non-selection. Note also that the base country is used as the base for doing this calculation for the player. Since the number of matches played by various countries varies by a factor of 2.5 to 1, comparisons with a single across-countries base would go haywire.
This is also done for Tests although the variations are far less for Tests.
For Tests, additional credit is given for away averages as compared to overall batting averages. Also away runs scored carry additional weight. The peer comparison is only on batting average.
For ODIs, a measure in between the Batting average and Runs per innings is determined, based on the number of innings and not outs and then the weighting points arrived at. Independent peer comparisons are done on both batting average and strike rate.
For both Tests and ODIs, the bowling quality is used by summing the product of "innings runs scored" and "average of other team bowling average" and dividing the "sum for all innings" by the "career runs scored". A very effective manner of doing this as proved by the fact that Gooch, who faced the formidable West Indian and Australian attacks, has a Test bowling quality figure of 31.98 (index value of 42.1), while Atapattu who has scored tons of runs against the weaker attacks has a bowling quality figure of 40.55 (index value of 10.0).
Now let me unveil the tables. These tables are current upto Test # 1944, which produced the unlikeliest of wins essayed by a resurgent and dynamic England side against a flat and insipid South Africa.
The best batsmen across formats - across years
Test   ODI   Test    ODI
Runs  Runs    Pts    Pts
500    500
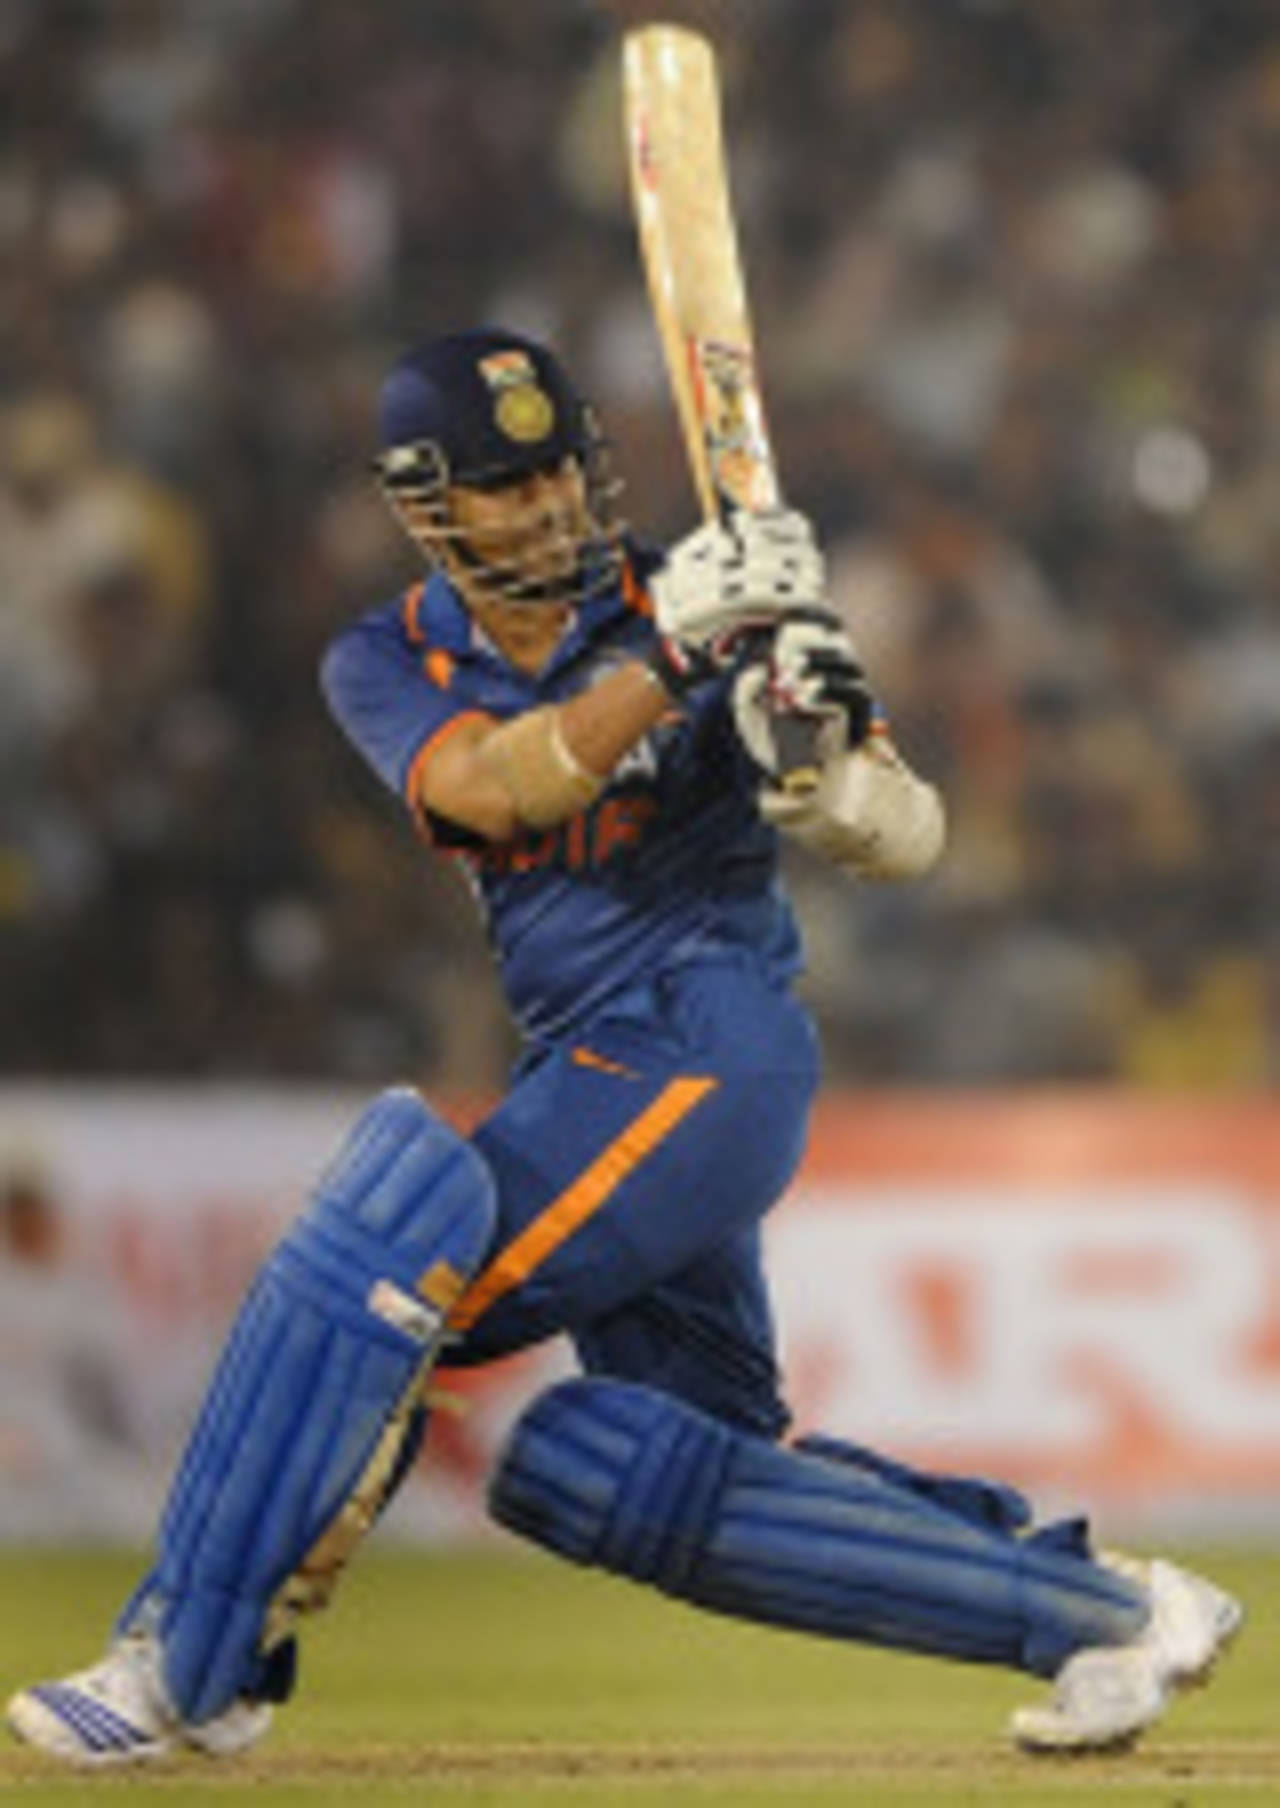
What does one say of Tendulkar. If one takes away the freakish numbers of Bradman, there is no one to touch Tendulkar. More than the runs he has scored, the manner in which he has scored, the balance, technique and poise he exhibits at the crease, his demeanour and impeccable behaviour, the way he conducts himself on and off the pitch, one could go on. Possibly the best thing I could say is that he is a role model, not just for the public, but for the other players.
After the wide gap comes Lara who just about edges ahead of Richards by single point. Two great West Indian batsmen, two of the greatest ever, are virtually tied for the second place. They are so close together, I am going to discuss them together.
Richards was by far the better ODI batsman than Lara, as evidenced by his second place in the ODI list. However Lara was quite a bit ahead of Richards in Tests, as again evidenced by his second place in the Test table. However what has happened is that each has wiped out the shortfall almost exactly with Lara gaining a point in this exchange. I do not need to say anything more of the two greats who, in different eras, have taken ODI and Test batting to great levels of entertainment. That they enjoyed varying degrees of success as team players and leaders was a reflection of the state of West Indian cricket at their respective times.
Ponting is a well-deserved fourth, couple of points behind. Those who question his leadership capabilities should not forget his batting achievements in both forms of the game. He is fourth in all the tables. In view of his age and form I expect Ponting to comfortably move the two West Indian greats to third/fourth places by end of 2010, or possibly earlier. It would be a well-deserved second place.
After some daylight, there is a surprise at the fifth position. Kallis is positioned here, ahead of Dravid. Kallis and Dravid are almost the same at Test level while Dravid is somewhat behind Kallis at ODI level. Anyhow I have heard many negative comments on these two great players. There is no doubt that Kallis has done most for South Africa amongst all players (let us not forget 509 international wickets). In what Dravid has done for India, he might be lagging behind only Tendulkar and Kapil Dev, and might be matched by Kumble and Gavaskar. Would Kallis and/or Dravid move above the two West Indian stalwarts is a difficult-to-answer question. Possibly Kallis who plays in both formats.
Two Australian fighters, Border and Steve Waugh, come in next. Both epitomized the never-say-die spirit and were responsible, through their batting (and captaincy) for the recent Australian revival. Only the churlish would begrudge their places at the top-10.
Now we get the two great Pakistani batsmen, Inzamam-ul-Haq and Javed Miandad. In a way these two are similar to the Australian duo who preceded them. Great fighters who would not give an inch. They were part of the great successes enjoyed by Pakistan over the years. In terms of contribution to the team cause, only Imran Khan would be ahead of them.
Note how closely positioned are Greenidge and Haynes.
The top-10 has 3 Australians, 2 Indians, 2 West Indians, 2 Pakistanis and one South African batsmen. A fair distribution, one would say, with 5 countries represented. For the record, Jayawardene, Gooch, Martin Crowe, Andy Flower and Habibul Bashar are their countrys' best batsmen.
If there is one placing which has surprised me most, it is that of Sehwag, who almost made it to the top-10. Arguably the most destructive batsman of all time, keep a watch on this eleventh placed batsman. Sehwag is moving fast and how. One more series of matches like the recent Sri Lankan ones would move him up in between the two Pakistani greats and then who knows where he might end. And remember that this high position is without being given any credit for his extraordinary Test strike rate.
To view/download the complete all-time list, updated on 7 Jan 2009, please right-click here and save the file.
Because of the length of the article I am not dwelling on the individual tables in depth. Suffice to say that Tendulkar, Lara, Border, Ponting, Dravid, Gavaskar, Steve Waugh, Kallis, Greg Chappell and Richards form the perfect-10 of the Test arena over the past 40 years.
To view/download the complete Test list, please right-click here and save the file.
And amongst the ODI-10 of Tendulkar, Richards, Jayasuriya, Ponting, Gilchrist, Lara, Sehwag, Zaheer Abbas, De Silva and Saeed Anwar, only Zaheer Abbas might raise a few eyebrows. However readers would do well to remember that 2500+ runs in 62 matches at an average of 47.63 and a strike rate of 84.5 is exceptional, amongst the top-5 of all time. I am assuming that, as Hussey and Dhoni have done, he would have maintained these numbers in 120+ matches. Then his high ranking points make sense and he fully deserves this position. He was as free-scoring as Richards and as graceful as Gower.
To view/download the complete ODI list, updated on 7 Jan 2009, please right-click here and save the file.
A request to readers. You have every right to comment negatively. Every right to fault this analysis. Every right to be upset. Every right to disagree. What you do not have is the right to be abusive, personal or otherwise, to me or to the other readers or to the great players themselves or to other countries. Your comment will, then, be seen by one person only, me. I have also decided that I will not do a follow-up analysis on this. This work has been done with lots of consultations and should not, and will not be, changed based on reader comments, however valid these may be.
A few readers have asked for the methodology used. This has been summarized in a text file. To view/download this document, please right-click here and save the file.
Anantha Narayanan has written for ESPNcricinfo and CastrolCricket and worked with a number of companies on their cricket performance ratings-related systems