Australia's consistency, fewer draws, and other trends
A statistical analysis of the trends across the four 500-Test periods
Madhusudhan Ramakrishnan
20-Jul-2011
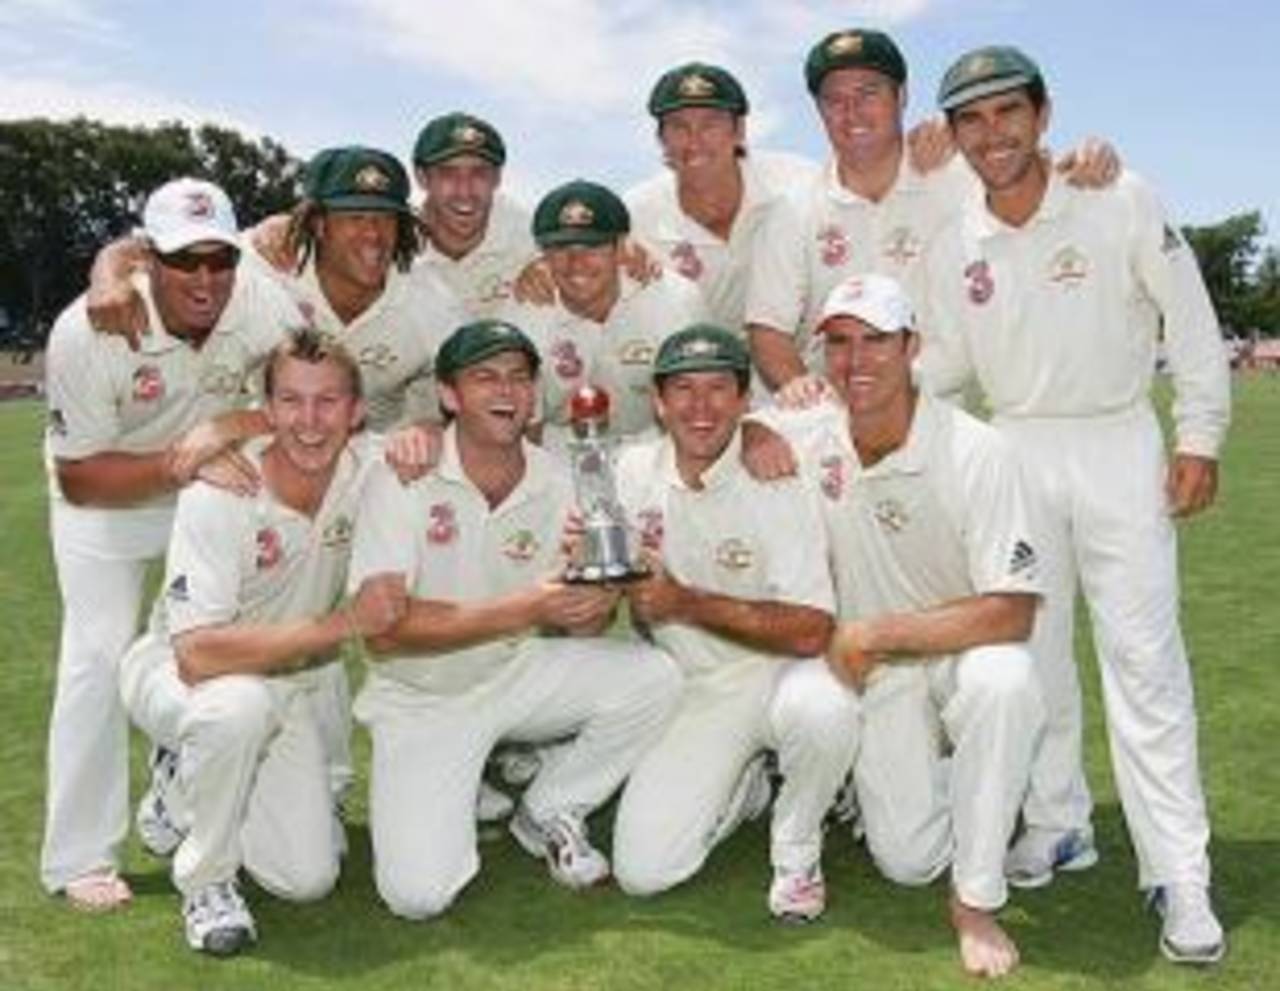
Australia have not only been the best team since 2000, but have also been the most consistent across the four 500-Test periods • Hamish Blair/Getty Images
Exponential increase in the number of matches
The most noticeable trend has been the proliferation of Test matches in recent times. While the 1000th match was played only as far back as 1984, nearly 107 years after the first match in 1877, the next 1000 matches have been played in 27 years at a rate of nearly 37 Tests per year. The first 500-Test period was spread across 83 years (10 years lost due to war) with an average of just over six Tests per year, while the second and third set of 500 Tests were played in 24 and 16 years respectively. However, the rate of Tests per year in the second (20) and third periods (31) is much lower than the extraordinary rate of nearly 45 Tests per year in the last 11 years.
The most noticeable trend has been the proliferation of Test matches in recent times. While the 1000th match was played only as far back as 1984, nearly 107 years after the first match in 1877, the next 1000 matches have been played in 27 years at a rate of nearly 37 Tests per year. The first 500-Test period was spread across 83 years (10 years lost due to war) with an average of just over six Tests per year, while the second and third set of 500 Tests were played in 24 and 16 years respectively. However, the rate of Tests per year in the second (20) and third periods (31) is much lower than the extraordinary rate of nearly 45 Tests per year in the last 11 years.
Better batting conditions
In the early phase of Test cricket, a number of matches were played on uncovered pitches, and hence the period witnessed a number of low-scoring games. In 408 completed team innings before the first World War (1877-1913), there were 53 scores runs per wicket, a figure that gradually rose to over 33 in the 1920s. Except for the 1950s, the runs-per-wicket figure has generally remained above 30 in every decade after the 1920s. In matches before the first World War (1877-1913), the average rate of hundreds was one every 36 innings, whereas in the second phase of the first 500-Test period (1914-1960), centuries were scored at a much quicker rate of one every 20 innings. As batting got a lot easier in the subsequent decades, centuries were scored at a rate of one every 20 innings in the second and third 500-Test periods. In the fourth one, the innings-per-century figure is the lowest (17.02), a rate nearly 20% quicker than the overall average (20.39).
In the early phase of Test cricket, a number of matches were played on uncovered pitches, and hence the period witnessed a number of low-scoring games. In 408 completed team innings before the first World War (1877-1913), there were 53 scores runs per wicket, a figure that gradually rose to over 33 in the 1920s. Except for the 1950s, the runs-per-wicket figure has generally remained above 30 in every decade after the 1920s. In matches before the first World War (1877-1913), the average rate of hundreds was one every 36 innings, whereas in the second phase of the first 500-Test period (1914-1960), centuries were scored at a much quicker rate of one every 20 innings. As batting got a lot easier in the subsequent decades, centuries were scored at a rate of one every 20 innings in the second and third 500-Test periods. In the fourth one, the innings-per-century figure is the lowest (17.02), a rate nearly 20% quicker than the overall average (20.39).
The other major change has been the scoring rate. What used to hover around the 2.50 mark till the mid-1980s has soared to more than 3.20 runs per over, thanks largely to the advent of limited-overs cricket.
- Don Bradman scored 29 centuries in 80 Tests (innings-per-century figure of 2.75). Among batsmen who have scored at least 15 centuries, Clyde Walcott (4.93), Herbert Sutcliffe (5.25) and Everton Weekes (5.40) follow Bradman. Tendulkar is fifth, with a century every 5.68 innings.
- Bradman also has the best conversion rate of fifties to centuries (hundreds to fifties ratio of 2.23 ) followed by Walcott (1.07) and Mohammad Azharuddin (1.04).
- Charles Bannerman's innings of 165 out of a team total of 245 in the first Test constituted 67.34% of the completed team total. This still remains a record for the highest percentage of runs in a completed team innings.
- In the second 500-Test period, 12 batsmen scored 2000-plus runs against a particular opposition. Among these batsmen, Sunil Gavaskar has the best average (65.45 against West Indies) followed by Ken Barrington and Garry Sobers, who have averages of 63.96 and 61.28 against Australia and England respectively.
| Tests | Period | Innings | Runs/innings | Runs/six balls | 100 | 50 | Inns/100 | Inns/50 |
| 1-500* | 1877-1960 | 17696 | 24.38 | 2.54 | 766 | 1882 | 23.14 | 9.40 |
| 501-1000 | 1960-1984 | 17684 | 26.45 | 2.67 | 854 | 2219 | 20.66 | 7.97 |
| 1001-1500 | 1984-2000 | 17281 | 25.76 | 2.85 | 791 | 2095 | 21.84 | 8.24 |
| 1501-1999 | 2000-2011 | 17686 | 28.25 | 3.23 | 1039 | 2263 | 17.02 | 7.81 |
| Overall (1-1999) | 1877-2011 | 70347 | 26.21 | 2.81 | 3450 | 8459 | 20.39 | 8.31 |
*On December 30, 1960, the day the 500th Test started, two matches were played. In all tables, the stats of the first period include only the Australia-West Indies game (the 500th Test), while the second match on that day (India-Pakistan) is included in the second period.
Result percentage on the rise
The reduction in the number of drawn Tests has been one of the biggest changes in Test cricket over the last decade. In the 499 Tests that have been played since June 16, 2000, only 128 have been drawn, which is a percentage of 25.65. That's easily the lowest among the four periods. In particular, the percentages have been very low for matches played in Australia and South Africa - in both cases they're well under 20%. Steve Waugh, who led Australia in 57 Tests, won 41 and drew just seven (12%).
The reduction in the number of drawn Tests has been one of the biggest changes in Test cricket over the last decade. In the 499 Tests that have been played since June 16, 2000, only 128 have been drawn, which is a percentage of 25.65. That's easily the lowest among the four periods. In particular, the percentages have been very low for matches played in Australia and South Africa - in both cases they're well under 20%. Steve Waugh, who led Australia in 57 Tests, won 41 and drew just seven (12%).
Only eight of the 129 Tests played in Australia between 1877 and 1960 were drawn, but this was mainly to do with the fact that most Tests played in Australia in the years before the second World War were Timeless Tests. A few matches in England, West Indies and South Africa were also played to the finish, but these do not significantly affect the draw percentages in those countries. The runs-per-wicket figure was highest in the West Indies and India in this period, which also corresponds with fairly high draw percentages in these countries (54% and 46%).
Even after the Timeless Test concept was abandoned, the draw percentage in Australia continued to stay much lower than in other countries. In the second 500-Test period, India and Pakistan had the highest averages and draw percentages. West Indies' top-class bowling attack meant that the draw percentage in the Caribbean fell rapidly in the 1980s and early 1990s, but over the last decade it has gone up again.
- Clive Lloyd led West Indies to 23 away wins in Tests, the most by an individual captain. Ricky Ponting and Steve Waugh are joint second, with 19 wins each.
- Among head-to-head contests that have featured at least 20 matches, the lowest draw percentage is 21.29% in Australia-West Indies Tests followed by Australia-South Africa (21.68%).
- There have been eight occasions when teams have reversed a lead of 200 runs or more at the end of the second innings and gone on to win the match. Apart from the 2006 Oval Test which was forfeited, the highest deficits overcome have been 291 by Australia against Sri Lanka in Colombo in 1992 and 274 by India against Australia in Kolkata in 2001.
| Host country | 1-500 | 501-1000 | 1001-1500 | 1501-1999 | Overall |
| Australia | 28.68, 6.20** | 32.58, 28.28 | 32.39, 30.95 | 36.13, 15.38 | 31.74, 19.09 |
| England | 28.74, 41.01 | 31.05, 39.02 | 33.74, 37.07 | 34.43, 23.07 | 31.29, 36.75 |
| India | 33.42, 53.84 | 32.04, 55.42 | 33.32, 34.54 | 38.17, 38.46 | 34.00, 46.28 |
| New Zealand | 27.52, 41.66 | 29.47, 50.00 | 33.18, 43.85 | 32.85, 31.81 | 31.28, 42.45 |
| Pakistan | 24.07, 46.66 | 35.59, 60.37 | 30.20, 44.44 | 38.75, 34.48 | 33.07, 48.34 |
| South Africa | 27.39, 30.37 | 32.67, 31.57 | 29.14, 31.57 | 32.67, 17.54 | 29.81, 26.94 |
| Sri Lanka | - | 26.79, 20.00* | 32.44, 50.00 | 33.63, 25.42 | 32.85, 34.31 |
| West Indies | 36.47, 45.94 | 35.65, 50.79 | 29.54, 32.25 | 34.45, 38.88 | 33.72, 41.66 |
| Overall | 29.22, 31.93 | 32.39, 44.08 | 31.90, 38.00 | 34.61, 22.65 | 32.03, 34.91 |
** The low draw percentage in Australia in the first period is predominantly due to the Timeless Tests.
* In the second period (1960-1984), only ten Tests were played in Sri Lanka, of which two were draws.
* In the second period (1960-1984), only ten Tests were played in Sri Lanka, of which two were draws.
Australia's dominance and West Indies' sharp fall
In the initial years when Australia and England were the dominant sides, matches against the other weaker sides, including South Africa, India and West Indies, were hardly challenging. While England dominated the head-to-head contests before the first World War, Australia were the better side between the wars predominantly due to the extraordinary batting achievements of Bradman, who scored 15 centuries at an average of 91.42 against England in the same period. In the years after the second World War, West Indies became a force to contend with and set the precedent for a highly-successful period by contesting a closely fought series in Australia in 1960-61. West Indies completely dominated the second half of the 1970s, and the 1980s. They won two consecutive series against England by 5-0 margins in 1984 and 1985-86 and did not lose a single Test series between 1980 and 1995. Following their historic series win in the Caribbean in 1995, Australia embarked on a remarkable run. They maintained a win-loss ratio of 3.37 in matches played since 2000, and set a record for winning 16 consecutive Tests on two different occasions.
In the initial years when Australia and England were the dominant sides, matches against the other weaker sides, including South Africa, India and West Indies, were hardly challenging. While England dominated the head-to-head contests before the first World War, Australia were the better side between the wars predominantly due to the extraordinary batting achievements of Bradman, who scored 15 centuries at an average of 91.42 against England in the same period. In the years after the second World War, West Indies became a force to contend with and set the precedent for a highly-successful period by contesting a closely fought series in Australia in 1960-61. West Indies completely dominated the second half of the 1970s, and the 1980s. They won two consecutive series against England by 5-0 margins in 1984 and 1985-86 and did not lose a single Test series between 1980 and 1995. Following their historic series win in the Caribbean in 1995, Australia embarked on a remarkable run. They maintained a win-loss ratio of 3.37 in matches played since 2000, and set a record for winning 16 consecutive Tests on two different occasions.
Until Sourav Ganguly took over the captaincy, India were a dominant side in home Tests, but a very poor team in away matches. Following their return from the ban, South Africa dominated every team except Australia before finally winning their first ever Test series in Australia in 2008-09. On the other hand, West Indies endured a torrid time in the 2000s with their win-loss ratio of 0.23 among the worst in cricket history. Australia, by far, have been the most successful team across the four periods and their high average difference (difference between batting and bowling averages) and excellent win-loss ratio shows how strong they have been.
- Between 1980 and 1995, West Indies played in 29 series without a single series defeat, a record for most consecutive Test series played without a single series defeat. Australia are second with 16 consecutive series between 2001 and 2005 without defeat.
- Among teams that have played at least 20 matches at a particular venue, Pakistan have the best win-loss ratio of 10.50 in Karachi (21 wins and two losses). Australia are next, with a win-loss ratio of 4.00 in Brisbane (32 wins and eight losses).
- Australia have successfully chased 300-plus targets on eight occasions, the most by any team. West Indies are second, having achieved the feat on five occasions.
| Team | 1-500 | 501-1000 | 1001-1500 | 1501-1999 | Overall |
| Australia | 124/69/58, 3.71 | 66/61/67, 0.74 | 70/38/51, 5.58 | 81/24/19, 12.18 | 341/192/195, 4.69 |
| England | 149/103/116, 4.13 | 73/54/111, 1.98 | 36/66/61, -5.61 | 64/38/40, 3.08 | 322/261/328, 1.82 |
| India | 6/29/34, -10.19 | 29/51/72, -3.63 | 26/32/53, 1.40 | 49/27/42, 3.66 | 110/139/201, -1.61 |
| New Zealand | 1/27/24, -17.73 | 18/45/47, -6.95 | 25/42/50, -4.96 | 24/33/28, -2.82 | 68/147/149, -6.76 |
| Pakistan | 8/9/14, -4.58 | 25/27/64, -0.28 | 43/29/49, 2.37 | 32/35/23, -1.10 | 108/100/150, 0.05 |
| South Africa | 27/72/43, -7.28 | 11/5/14, 6.73 | 32/14/24, 7.15 | 55/33/28, 7.17 | 125/124/109, 1.00 |
| Sri Lanka | - | 0/8/4, -13.80 | 18/32/38, -6.03 | 43/31/27, 6.76 | 61/71/69, -0.16 |
| West Indies | 25/31/29, 0.27 | 57/28/63, 4.83 | 56/34/36, 3.22 | 15/63/35, -9.44 | 153/156/163, 0.30 |
Spin back in favour
A combination of uncovered pitches and quality spinners meant that spin contributed significantly to the wickets tally in the first 500-Test period. Nearly 34% of the total wickets fell to spinners, and almost 14% to bowlers who bowled a mix of pace and spin. The classification of bowlers was much more distinct and acccurate in later years, and hence the low percentage of wickets contributed by the bowlers in the 'mixed/unknown' category. From the second 500-Test period onwards, pace bowlers dominated the wickets tally and picked up over 60% of the total wickets to fall. In the period between 1984 to 2000 (Tests 1001-1500), pitches were more pace-friendly, and there was a dearth of quality spinners. As a result, the role of spin was drastically reduced and fast bowlers picked up more than twice as many wickets as spinners in that period. However, the presence of Shane Warne, Anil Kumble and Muttiah Muralitharan ensured that the contribution of spinners rose again to nearly 33% in the last 500-Test period.
A combination of uncovered pitches and quality spinners meant that spin contributed significantly to the wickets tally in the first 500-Test period. Nearly 34% of the total wickets fell to spinners, and almost 14% to bowlers who bowled a mix of pace and spin. The classification of bowlers was much more distinct and acccurate in later years, and hence the low percentage of wickets contributed by the bowlers in the 'mixed/unknown' category. From the second 500-Test period onwards, pace bowlers dominated the wickets tally and picked up over 60% of the total wickets to fall. In the period between 1984 to 2000 (Tests 1001-1500), pitches were more pace-friendly, and there was a dearth of quality spinners. As a result, the role of spin was drastically reduced and fast bowlers picked up more than twice as many wickets as spinners in that period. However, the presence of Shane Warne, Anil Kumble and Muttiah Muralitharan ensured that the contribution of spinners rose again to nearly 33% in the last 500-Test period.
| Tests | Period | Pace | % of total (pace) | Spin | % of total(spin) | Mixed/ Unknown | % of total(mixed) |
| 1-500 | 1877-1960 | 7436, 28.11 | 48.06 | 5292, 30.12 | 34.20 | 2144, 29.36 | 13.85 |
| 501-1000 | 1960-1984 | 9415, 29.55 | 61.44 | 4671, 35.38 | 30.48 | 676, 36.76 | 4.41 |
| 1001-1500 | 1984-2000 | 10262, 29.87 | 68.44 | 4030, 35.98 | 26.87 | 194, 43.10 | 1.29 |
| 1501-1999 | 2000-2011 | 9776, 33.59 | 63.52 | 4974, 36.26 | 32.32 | 129, 40.49 | 0.83 |
| Overall | 1877-2011 | 36889, 30.42 | 60.30 | 18967, 34.27 | 31.00 | 3143, 32.26 | 5.13 |
After the first period of 500 Tests (1877-1960), most grounds in Australia and England offered little support for spinners. In the years before the first World War, five of the top ten bowlers were spinners, and the success for spinners continued in the years between the two World Wars. Between 1914 and 1939, Clarrie Grimmett and Bill O'Reilly formed a highly potent spin combination for Australia. They picked up over 65% (169 out of 259) wickets to fall in the 15 matches they played together between the wars. Hedley Verity, a victim of the Second World War, was another outstanding spinner in the same period. He dismissed Don Bradman eight times in 17 Tests, the most times that Bradman has been dismissed by a bowler. However, spinners lost the hold in the second 500-Test period. Their percentage contribution fell under 30 in Australia and just over 21 in England. Pace bowlers dominated the wickets tally in New Zealand, South Africa and West Indies too in the same period. India and Pakistan, however, remained the best for spin, with spinners picking up over 47% of the total wickets in these two countries. The spin quartet from India picked up 853 wickets, contributing over 18% of the total wickets picked up by spinners in the same period.
Even as spinners' contribution fell in England and South Africa in the subsequent phase (1984-2000), the corresponding number rose to nearly 55% in India. The rise of Wasim Akram and Waqar Younis in the late 1980s meant that pace once again dominated the scene in Pakistan. Warne, who made his debut in 1992, picked up nearly half the total number of wickets that fell to spinners in Australia in Tests between 1992 and 2000. Muralitharan, Test cricket's highest wicket-taker, was utterly dominant in home Tests. He picked up 364 wickets in 48 Tests at an average just over 18 in the fourth 500-Test period. In the 1970s and 1980s, West Indies relied almost exclusively on pace, as only 16% of wickets fell to spin. But with the quality of their pace attack declining and the pitches becoming more docile, spinners were much more effective on West Indian tracks in later years and picked up close to 30% of the total wickets.
- Muralitharan is the only bowler to pick up 100-plus wickets at a single venue. Remarkably, he has achieved the feat at three different venues (SSC, Kandy and Galle).
- Shane Warne has picked up 195 wickets against England, the most by a bowler against an opponent. Dennis Lillee and Curtly Ambrose are next, with 167 and 154 wickets respectively against England.
- Javagal Srinath holds the record for the best match bowling performance in a defeat with 13 for 132 against Pakistan in Kolkata in 1999.
| Country | 1-500 | 501-1000 | 1001-1500 | 1501-1999 | Overall |
| Australia | 47.06, 29.90 | 68.24, 23.04 | 70.99, 24.45 | 66.11, 27.45 | 60.92, 26.52 |
| England | 50.23, 34.95 | 71.87, 21.08 | 77.76, 18.57 | 75.36, 21.03 | 65.59, 25.72 |
| India | 40.28, 47.45 | 46.32, 47.04 | 41.49, 54.28 | 43.33, 51.77 | 43.54, 49.91 |
| New Zealand | 44.88, 36.42 | 67.19, 25.38 | 72.33, 22.15 | 74.59, 22.00 | 68.07, 24.80 |
| Pakistan | 50.66, 36.12 | 45.39, 47.45 | 64.74, 31.28 | 57.67, 37.20 | 55.46, 38.31 |
| South Africa | 49.72, 32.30 | 65.80, 27.41 | 77.05, 18.45 | 79.30, 17.64 | 65.28, 24.84 |
| Sri Lanka | - | 60.50, 31.21 | 49.29, 42.81 | 45.21, 50.58 | 47.45, 46.82 |
| West Indies | 46.30, 37.42 | 54.68, 32.69 | 78.71, 16.73 | 66.94, 29.88 | 63.28, 28.18 |