Australia hit 32-year low at home
Stats highlights of Australia's collapse for 85 on the first day of the second Test against South Africa in Hobart
Gaurav Sundararaman
12-Nov-2016
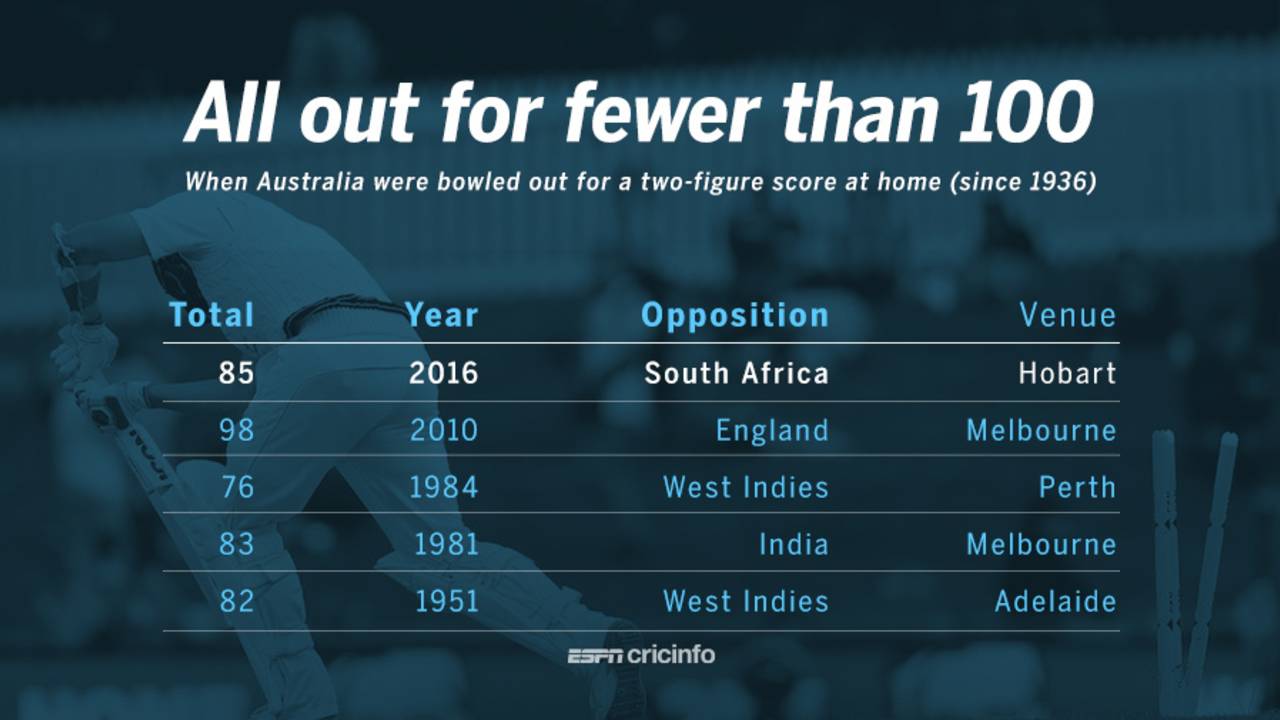
This is only the fifth instance since 1936 that Australia have been bowled out for below 100 at home • ESPNcricinfo Ltd
| Total | Inns | Result | Opposition | Ground | Year |
| 42 | 2 | lost | England | Sydney | 1888 |
| 58 | 4 | lost | England | Brisbane | 1936 |
| 66 | 4 | lost | England | Brisbane | 1928 |
| 76 | 2 | lost | West Indies | Perth | 1984 |
| 80 | 2 | lost | England | Sydney | 1936 |
| 82 | 4 | lost | England | Sydney | 1888 |
| 82 | 1 | lost | West Indies | Adelaide | 1951 |
| 83 | 4 | lost | England | Sydney | 1883 |
| 83 | 4 | lost | India | Melbourne | 1981 |
| 84 | 2 | lost | England | Sydney | 1887 |
| 85 | 1 | - | South Africa | Hobart | 2016 |
197 The number of balls South Africa took to dismiss Australia. It was Australia's second shortest innings at home in terms of balls faced since 1936, after the Perth Test against West Indies in 1984. Till 1936, they had seven such instances.
11 Instances of Australia being bowled out in under 200 balls in a Test innings since 1950. Only two of those have been at home, while six have been in England.
| Score | Overs | Inngs | Opposition | Ground | Year |
| 47 | 18.0 | 3 | South Africa | Cape Town | 2011 |
| 60 | 18.3 | 1 | England | Nottingham | 2015 |
| 130 | 30.2 | 2 | England | Manchester | 1981 |
| 93 | 30.5 | 4 | India | Mumbai | 2004 |
| 76 | 31.2 | 2 | West Indies | Perth | 1984 |
| 103 | 31.3 | 2 | England | Leeds | 1977 |
| 118 | 31.5 | 1 | England | Birmingham | 1997 |
| 104 | 32.1 | 4 | England | The Oval | 1997 |
| 85 | 32.5 | 1 | South Africa | Hobart | 2016 |
| 88 | 33.1 | 1 | Pakistan | Leeds | 2010 |
| 106 | 33.2 | 2 | Sri Lanka | Galle | 2016 |
17 The lowest score at which Australia have lost half their side in the first innings of a Test. The previous lowest was 21, against England at Trent Bridge in 2015. Their score at the fall of the sixth wicket in Hobart - 31 - was also their second lowest at home.
8 Instances of an Australian batsman scoring a higher percentage of the team's runs than Steven Smith. Smith contributed 48 unbeaten runs out of Australia's 85 (56.47%). The last time an Australian batsman contributed a higher percentage was in 1999, when Michael Slater scored 123 out of Australia's 184 (66.84%) against England in Sydney. In team totals of below 100, this is the fifth-highest contribution ever: only Asanka Gurusinha (63.41%), Mohinder Amarnath (61.85%), Len Hutton (57.69%) and Trevor Goddard (56.56%) have done better.
| Player | Runs | Total | % | Opposition | Ground | Year |
| Charles Bannerman | 165* | 245 | 67.34 | England | Melbourne | 1877 |
| Michael Slater | 123 | 184 | 66.84 | England | Sydney | 1999 |
| Graham Yallop | 121 | 198 | 61.11 | England | Sydney | 1979 |
| Victor Trumper | 74 | 122 | 60.65 | England | Melbourne | 1904 |
| Don Bradman | 334 | 566 | 59.01 | England | Leeds | 1930 |
| Don Bradman | 299* | 513 | 58.28 | South Africa | Adelaide | 1932 |
| Clem Hill | 188 | 323 | 58.20 | England | Melbourne | 1898 |
| Bob Cowper | 165 | 292 | 56.50 | India | Sydney | 1968 |
| Steven Smith | 48* | 85 | 56.47 | South Africa | Hobart | 2016 |
| Stan McCabe | 232 | 411 | 56.44 | England | Nottingham | 1938 |
6 for 43 Australia's worst first session of a home Test since the 4 for 58 against England in the Boxing Day Test in 2010. There have been only three worse first sessions for any team since then. Australia were dismissed in the first session at Trent Bridge, Pakistan lost 6 for 36 at Edgbaston, and New Zealand were dismissed for 45 at Newlands.
2 Runs by Australia's openers - the fewest they have scored since the game against England in Nottingham in 2015. Before that, both openers were dismissed for no runs against Sri Lanka in Kandy in 1999.
3 Number of innings in which the opposition has been dismissed for fewer than 100 and Philander has taken a five-for. Apart from today's game, Philander took 5 for 7 against New Zealand and 5 for 15 against Australia.