Control C in the Ashes
Steven Smith, Chris Rogers and Joe Root were the leading run scorers in the Ashes, but another batsman had better control stats than all of them
S Rajesh
28-Aug-2015
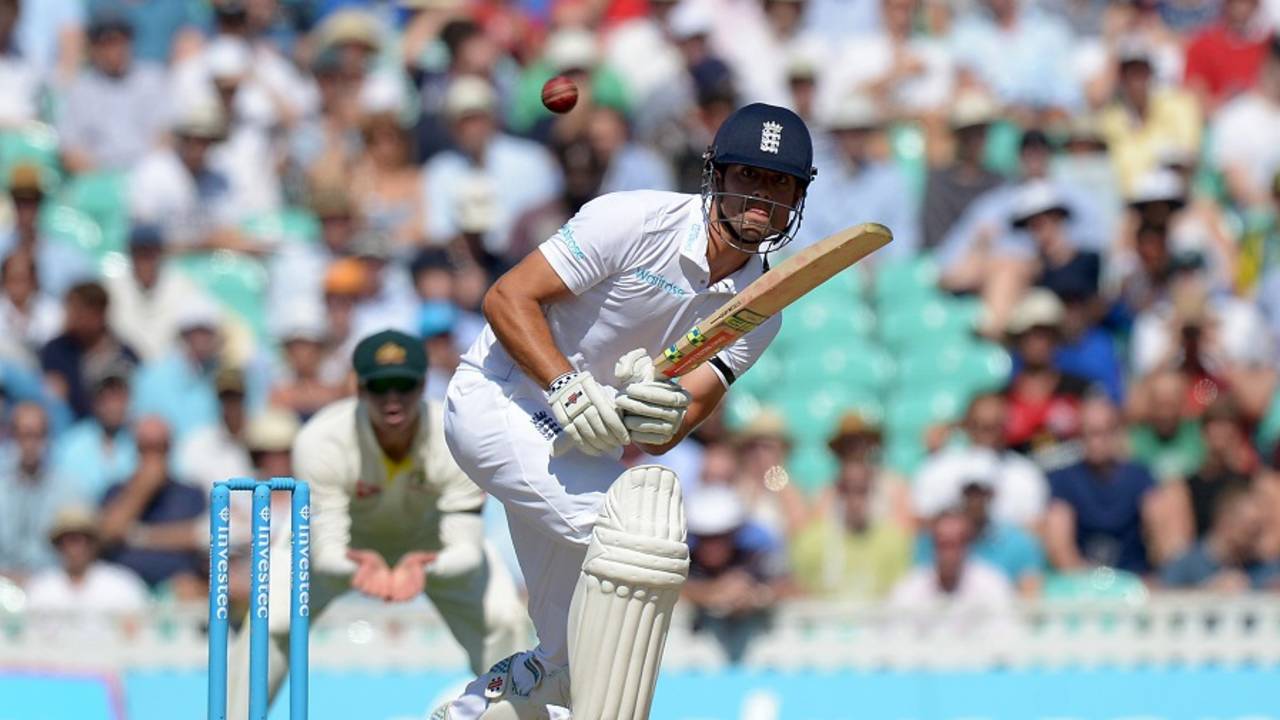
Alastair Cook and Moeen Ali both averaged almost the same in the Ashes series, but were on opposite ends of the control-factor spectrum • PA Photos
Steven Smith was the leading run scorer in the series, Chris Rogers played more deliveries than anyone else, while Smith and Joe Root were the only batsmen to score multiple hundreds in Ashes 2015. Yet, you could argue that the batsman who looked the most assured over the entire series wasn't any of these three, but England's captain, Alastair Cook. Four batsmen scored more runs than Cook in the series, but according to ESPNcricinfo's control factor stats, none of them were as assured at the crease as the England captain.
Control factor seeks to measure the percentage of deliveries a batsman played, where the ball went exactly where the batsman intended it to go: that is, he either middled the ball or left it alone; the not-in-control deliveries are the ones which beat the bat or induced edges. A batsman may score a hundred despite getting beaten numerous times, and, on the other hand, might score a fluent, flawless 30, but the first mistake he commits might lead to his dismissal. The nature of batting is such that the final score of a batsman doesn't always indicate how well he played.
Throughout the 2015 Ashes, several experts, most notably Nasser Hussain, said several times that Cook never looked out of form over the five Tests yet found ways to get himself out; he passed 50 just twice, and both were in Tests England lost. The table below justifies Hussain's analysis: of the 732 balls Cook faced in the series, his control factor was very nearly 88%, which is the highest among all batsmen who faced at least 240 balls in the series. But his average was 36.66, clearly below the target he would have set for himself when the series began. In the earlier series of the summer, against New Zealand, Cook's control factor was only marginally higher - 89.7% - but his average in that series was more than twice as high: 77.25, with three 50-plus scores in four innings, including a highest of 162. Batsmen often tend to say that they felt good and were timing it well in the nets despite not getting huge scores; if Cook says that, he's clearly not bluffing.
In fact, the table below suggests there isn't necessarily a strong correlation between control factor and runs scored in a series. Batsmen who bat longer usually middle more deliveries as their innings goes along and hence tend to have higher control percentages, but batsmen with similar amount of runs in a series may end up with widely varying control percentages.
The stats for Cook and Moeen Ali amply illustrate this. Both had similar series with the bat in terms of runs scored and batting averages, but while Cook was solid and gave very few opportunities to the bowlers, Moeen was a wicket waiting to fall in most of his innings, flailing outside off repeatedly. When he connected, he usually got a boundary, but he was lucky he failed to make contact as often as he did. Cook's control factor, on the other hand, is even more creditable given that he opened the batting and battled against the new ball and the Australian bowlers when they were at their freshest. Their averages in the series differed by 0.04, but Cook and Moeen are at two ends of the table below, which sorts batsmen by their control factors.
Smith had a high control factor as well. Despite looking ungainly at times, he ended up middling plenty of deliveries. Also, in the two Tests when conditions were really tough for the Australian batsmen, he got out early. Adam Voges is up there too, indicating he wasn't as out-of-sorts as his numbers suggest, while David Warner fought it out and got a half-century in each despite never really coming to grips with the conditions.
For England, the big surprise is the relatively high control stats for Jos Buttler - it's marginally higher than Root's control factor.
| Batsman | Total balls | In control% | not in control% | Bat ave |
| Alastair Cook | 732 | 87.8 | 11.7 | 36.66 |
| Steven Smith | 808 | 85.9 | 13.9 | 56.44 |
| Adam Voges | 425 | 83.3 | 16.2 | 28.71 |
| Chris Rogers | 826 | 82.4 | 17.4 | 60.00 |
| Jos Buttler | 247 | 82.2 | 17.8 | 15.25 |
| Joe Root | 686 | 81.5 | 18.5 | 57.50 |
| Ben Stokes | 309 | 79.6 | 20.4 | 25.12 |
| Peter Nevill | 313 | 79.2 | 20.8 | 23.83 |
| Adam Lyth | 251 | 76.9 | 23.1 | 12.77 |
| Michael Clarke | 241 | 76.8 | 23.2 | 16.50 |
| Ian Bell | 382 | 76.7 | 22.5 | 26.87 |
| David Warner | 561 | 75.0 | 24.4 | 46.44 |
| Mitchell Starc | 270 | 73.7 | 26.3 | 22.42 |
| Moeen Ali | 410 | 73.4 | 26.6 | 36.62 |
It's not surprising that the innings with the highest control factor (with a minimum of 50 balls faced) came from Cook, and the one with the lowest control factor came from Moeen. Cook's best was his 96 from 233 balls at Lord's, which had a control factor of almost 92. In fact, that was the only innings in the entire series with a control percentage of more than 90. The next two innings with highest control percentages are also from the Lord's Test - Smith's double-hundred, and Rogers' second-innings 49; his first-innings century comes a little further down the list. The only innings from Edgbaston and Trent Bridge - the two toughest pitches of the series - are from Root and Cook. Smith, Rogers and Cook all have three innings each in the top 15.
On the other hand, the innings with the lowest control factor was Moeen's second-innings effort of 35 at The Oval, when he played and missed numerous times and frustrated Australia's bowlers no end as they searched for a win before the rains came down. His control factor of 53.4% is easily the poorest among all innings in the series (with a 50-ball cut-off). Warner's three fifties at Trent Bridge, Cardiff and Edgbaston are all in the top ten, while at No. 11 is the innings that changed the course of the first Test - Root's aggressive and game-changing 134. Apart from being dropped on zero Root also played and missed a fair number of times, but rode his luck and batted long enough to alter the course of the match, and perhaps the series.
| Batsman | Runs (Balls) | Venue | in control | not in control |
| Alastair Cook | 96 (233) | Lord's | 91.8 | 8.2 |
| Steven Smith | 215 (346) | Lord's | 89.6 | 10.4 |
| Chris Rogers | 49 (77) | Lord's | 89.6 | 10.4 |
| Joe Root | 38 (63) | Edgbaston | 88.9 | 11.1 |
| Adam Voges | 31 (75) | Cardiff | 88.0 | 12.0 |
| Shane Watson | 19 (58) | Cardiff | 87.9 | 12.1 |
| Shane Watson | 30 (57) | Cardiff | 87.7 | 12.3 |
| Moeen Ali | 39 (57) | Lord's | 87.7 | 12.3 |
| Chris Rogers | 173 (300) | Lord's | 87.7 | 12.3 |
| Joe Root | 63 (75) | Edgbaston | 87.0 | 13.0 |
| Alastair Cook | 85 (234) | The Oval | 86.4 | 13.6 |
| Alastair Cook | 43 (87) | Trent Bridge | 86.2 | 13.8 |
| Steven Smith | 33 (56) | Cardiff | 86.0 | 14.0 |
| Steven Smith | 143 (252) | The Oval | 85.8 | 14.2 |
| Chris Rogers | 95 (133) | Cardiff | 85.8 | 14.2 |
| Batsman | Runs (Balls) | Venue | in control | not in control |
| Moeen Ali | 35 (57) | The Oval | 53.4 | 46.6 |
| David Warner | 64 (74) | Trent Bridge | 64.9 | 35.1 |
| Stuart Broad | 31 (55) | Edgbaston | 67.3 | 32.7 |
| Chris Rogers | 52 (89) | Edgbaston | 68.5 | 31.5 |
| Moeen Ali | 59 (78) | Edgbaston | 68.8 | 31.3 |
| Peter Nevill | 17 (57) | Trent Bridge | 71.9 | 28.1 |
| David Warner | 52 (86) | Cardiff | 72.1 | 27.9 |
| David Warner | 77 (62) | Edgbaston | 72.1 | 27.9 |
| Adam Lyth | 37 (62) | Cardiff | 72.6 | 27.4 |
| Mitchell Starc | 58 (108) | Edgbaston | 75.0 | 25.0 |
| Joe Root | 134 (166) | Cardiff | 75.3 | 24.7 |
Cook fell to Nathan Lyon three times in the series and averaged only 19.66 against him, but his control factor against Lyon was more than 92%. He made few mistakes against Lyon, but they turned out to be costly ones. It was similar for Warner against Moeen, though Warner's method was far more aggressive, and his dismissals were often a result of recklessness. In the other instances of high control factors, though, the bowlers had little joy, with zero dismissals in six of those ten combinations.
The table of batsmen who were troubled by specific bowlers is more interesting as there are instances of bowlers troubling batsmen yet having little to show for it in terms of dismissals. Against Mitchell Starc, for example, Moeen got 74 from 81 balls, yet his control factor was a dismal 65%. Of the 74 runs he scored off Starc, 30 came from uncontrolled strokes.
Similarly, Warner's numbers against England's new-ball pair is equally interesting. Looking at the runs-balls-dismissals stats, it appears as if Warner did much better against Broad than against Anderson, but the control numbers say something entirely different: Warner had an equally tough time against both bowlers. His aggressive style of batsmanship probably hurts his control numbers as well as miscued strokes all add to his not-in-control stats. Warner didn't do that much better against Stokes or Wood, but survived it all to score fifties in each Test and finish the series with very impressive numbers.
Sometimes, though, runs and averages don't tell the whole story.
| Batsman-Bowler | Balls | In control% | Not in control % | Runs | Dismissals | Average |
| Alastair Cook-Nathan Lyon | 186 | 92.47 | 6.45 | 59 | 3 | 19.66 |
| Chris Rogers-Moeen Ali | 140 | 90.71 | 8.57 | 72 | 0 | _ |
| Steven Smith-James Anderson | 112 | 90.18 | 9.82 | 63 | 0 | _ |
| Steven Smith-Ben Stokes | 157 | 89.81 | 10.19 | 85 | 0 | _ |
| David Warner-Moeen Ali | 77 | 89.61 | 10.39 | 69 | 4 | 17.25 |
| Steven Smith-Moeen Ali | 162 | 88.27 | 11.11 | 142 | 2 | 71.00 |
| Ben Stokes-Nathan Lyon | 79 | 88.61 | 11.39 | 62 | 1 | 62.00 |
| Joe Root-Nathan Lyon | 111 | 88.29 | 11.71 | 83 | 0 | _ |
| Alastair Cook-Josh Hazlewood | 159 | 87.42 | 11.95 | 68 | 0 | _ |
| Steven Smith-Mark Wood | 149 | 87.92 | 12.08 | 66 | 0 | _ |
| Batsman-Bowler | Balls | In control% | Not in control % | Runs | Dismissals | Average |
| Moeen Ali-Mitchell Starc | 81 | 65.43 | 34.57 | 74 | 1 | 74.00 |
| David Warner-Stuart Broad | 134 | 69.4 | 29.85 | 66 | 0 | _ |
| David Warner-James Anderson | 72 | 70.83 | 29.17 | 32 | 3 | 10.66 |
| Ben Stokes-Mitchell Starc | 67 | 71.64 | 28.36 | 36 | 2 | 18.00 |
| David Warner-Ben Stokes | 78 | 71.79 | 28.21 | 62 | 1 | 62.00 |
| Peter Nevill-Steven Finn | 70 | 72.86 | 27.14 | 19 | 2 | 9.50 |
| David Warner-Mark Wood | 116 | 72.41 | 26.72 | 110 | 1 | 110.00 |
| Adam Voges-Steven Finn | 75 | 73.33 | 26.67 | 38 | 1 | 38.00 |
| Moeen Ali-Mitchell Johnson | 90 | 73.33 | 26.67 | 63 | 4 | 15.75 |
| Michael Clarke-Mark Wood | 55 | 74.55 | 25.45 | 29 | 2 | 14.50 |
With inputs from Shiva Jayaraman. Control stats recorded by ESPNcricinfo's data team.
S Rajesh is stats editor of ESPNcricinfo. Follow him on Twitter