Spinners make impact in helpful conditions
A statistical analysis on how the spinners fared in this Champions Trophy compared to other editions
Shiva Jayaraman
18-Jun-2013
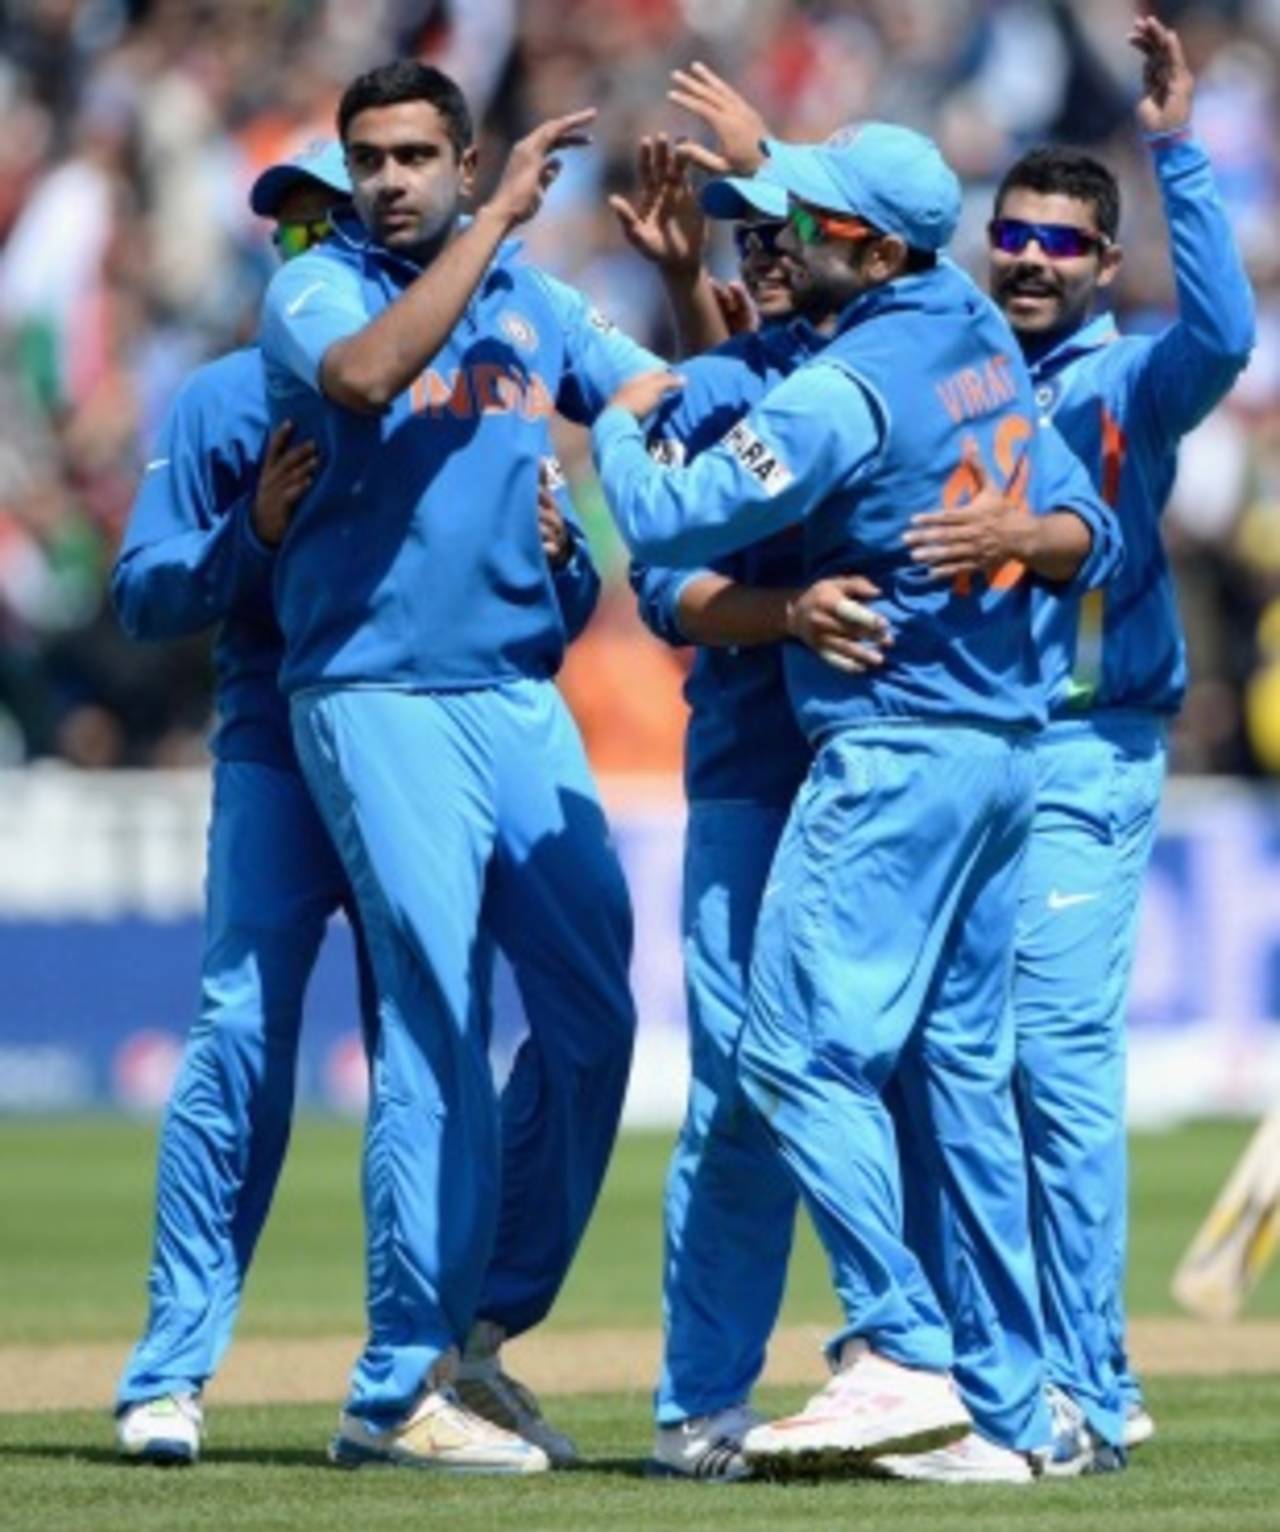
Indian spinners found the pitch conditions much to their liking in the Champions Trophy • Getty Images
The role spinners played in the final of the Champions Trophy between India and England aptly summed up their performance, in general, in the tournament. On a number of occasions in the tournament, the spinners stemmed the flow of runs and suffocated the batsmen into making mistakes. No doubt, they were aided by pitch conditions that were unlike the norm at this time of the year in England. But do the numbers validate the general impression of 'spin-friendly' conditions that prevailed in this Champions Trophy?
Spinners - overall
The stats seem to validate the premise - the average and the strike rate of spin bowlers in this Champions Trophy were the best in all the editions of the tournament - and that is an interesting evidence considering that three of the seven editions have been played in the subcontinent.
But, as the table below indicates, England was not such a bad venue for spinners the last time the tournament was played here in 2004, either. That year ranks third in terms of the bowling average and strike rate for spinners. However, spinners bowled more overs in this Champions Trophy - an indication of how spin-friendly the conditions were. Spinners bowled an average of 27 overs per match in this Champions Trophy as opposed to 19 overs in the 2004-edition. Considering the average length of the matches this year was much shorter due to inclement weather, this was a significant increase in teams' dependence on spin. In percentage terms, only the inaugural edition in Bangladesh (47% overs from spinners) and the 2002-edition played in Sri Lanka (41%), saw more overs from spinners than this edition (35%).
| Season | Venue | Wkts | Avg | Econ | SR | Avg spin-overs/mat | Avg overs/mat | %age spin |
| 2013 | England | 62 | 29.93 | 4.57 | 39.2 | 27 | 78 | 35 |
| 2006 | India | 75 | 30.10 | 3.93 | 45.8 | 27 | 84 | 32 |
| 2004 | England | 41 | 32.41 | 4.54 | 42.8 | 19 | 81 | 24 |
| 2002 | Sri Lanka | 74 | 32.89 | 4.48 | 44.0 | 34 | 83 | 41 |
| 2009 | South Africa | 48 | 34.22 | 4.73 | 43.3 | 23 | 86 | 27 |
| 1998 | Bangladesh | 41 | 40.36 | 4.73 | 51.1 | 44 | 93 | 47 |
| 2000 | Kenya | 27 | 44.44 | 4.41 | 60.2 | 27 | 93 | 29 |
Subcontinent spinners
Spinners from the subcontinent took 35 wickets in the tournament at a strike rate of 32.4, which is the best, by far, among all the editions of the tournament. This is more than double the number of wickets they took the last time the tournament was played in England. Their bowling average of 23.14 was also the best among all the seasons. Interestingly, the only two five-wicket hauls by spinners in the Champions Trophy have both come in England.
| Season | Venue | Matches | Overs | Mdns | Wkts | BBI | Avg | Econ | SR |
| 2013 | England | 10 | 189.1 | 11 | 35 | 5/36 | 23.14 | 4.28 | 32.4 |
| 2002 | Sri Lanka | 11 | 290 | 15 | 43 | 4/15 | 27.65 | 4.10 | 40.4 |
| 2006 | India | 13 | 296.2 | 12 | 38 | 4/23 | 28.97 | 3.71 | 46.7 |
| 2004 | England | 8 | 117.4 | 7 | 17 | 5/11 | 29.17 | 4.21 | 41.5 |
| 2009 | South Africa | 9 | 186.2 | 4 | 27 | 3/30 | 32.18 | 4.66 | 41.4 |
| 1998 | Bangladesh | 5 | 152 | 3 | 20 | 4/38 | 35.85 | 4.71 | 45.6 |
| 2000 | Kenya | 8 | 197 | 14 | 18 | 2/22 | 44.50 | 4.06 | 65.6 |
Non-subcontinent spinners v subcontinent batsmen
A stronger indication of the 'spin-friendly' conditions was the number of overs that were bowled by non-subcontinental teams to subcontinent batsmen, generally considered good players of spin. They bowled 112.1 overs to the subcontinent batsmen in eight games, the most they have bowled in any edition, and as many as 37 of these overs were bowled by part-time bowlers. Spinners from outside the subcontinent took 14 wickets against the subcontinent teams, equaling the highest for a Champions Trophy edition. Their economy of 4.45 was also the best in any Champions Trophy.
| Season | Venue | Matches | Overs | Mdns | Wkts | BBI | Avg | Econ | SR |
| 2013 | England | 8 | 112.1 | 3 | 14 | 3/34 | 35.71 | 4.45 | 48.0 |
| 2006 | India | 11 | 108.2 | 1 | 14 | 2/5 | 35.50 | 4.58 | 46.4 |
| 2004 | England | 7 | 31.2 | 0 | 8 | 3/23 | 18.12 | 4.62 | 23.4 |
| 2002 | Sri Lanka | 8 | 95.5 | 6 | 7 | 2/10 | 64.28 | 4.69 | 82.1 |
| 2009 | South Africa | 8 | 54.1 | 3 | 6 | 3/43 | 43.50 | 4.81 | 54.1 |
| 1998 | Bangladesh | 5 | 82.4 | 1 | 12 | 4/31 | 35.50 | 5.15 | 41.3 |
| 2000 | Kenya | 6 | 34.0 | 0 | 1 | 1/18 | 206 | 6.05 | 204 |
Pace v Spin in Batting Powerplay
Spinners seemed to have fared better, in terms of their economy, than pace bowlers in the batting Powerplay in this Champions Trophy, but they were bowled much less in these overs. In 30 overs of batting Powerplay, spinners conceded runs at an economy of 5.13 as opposed to 6.66 by pace bowlers. However, pace bowlers took 23 wickets at a strike rate of 20.3, as opposed to the spinners, who took eight wickets at a marginally worse strike rate of 22.5.
| Runs conceded | Overs | Eco | Wkt | Avg | SR | |
| Spin | 154 | 30 | 5.13 | 8 | 19.25 | 22.5 |
| Pace | 520 | 78 | 6.66 | 23 | 22.60 | 20.3 |
Best spin-bowling unit and New Zealand's feat
With 20 wickets from five games at 19.5 runs apiece, India's spinners were clearly the best in the tournament. The surprise of the tournament though was New Zealand bowling 57 overs of spin, the second highest by any team in the tournament. Of these, 30 overs were bowled in their match against Australia - a record for the most overs bowled by spinners in a match for New Zealand. Proof enough that the conditions in England, as evident in the Champions Trophy, aided spinners like never before.
Shiva Jayaraman is a sub-editor (stats) at ESPNcricinfo