Batting Pakistan's Achilles' heel
Pakistan's bowling compares favourably with that of the hosts but the visitors' batting will undoubtedly hold the key to their fortunes
Madhusudhan Ramakrishnan
Jan 30, 2013, 6:12 PM
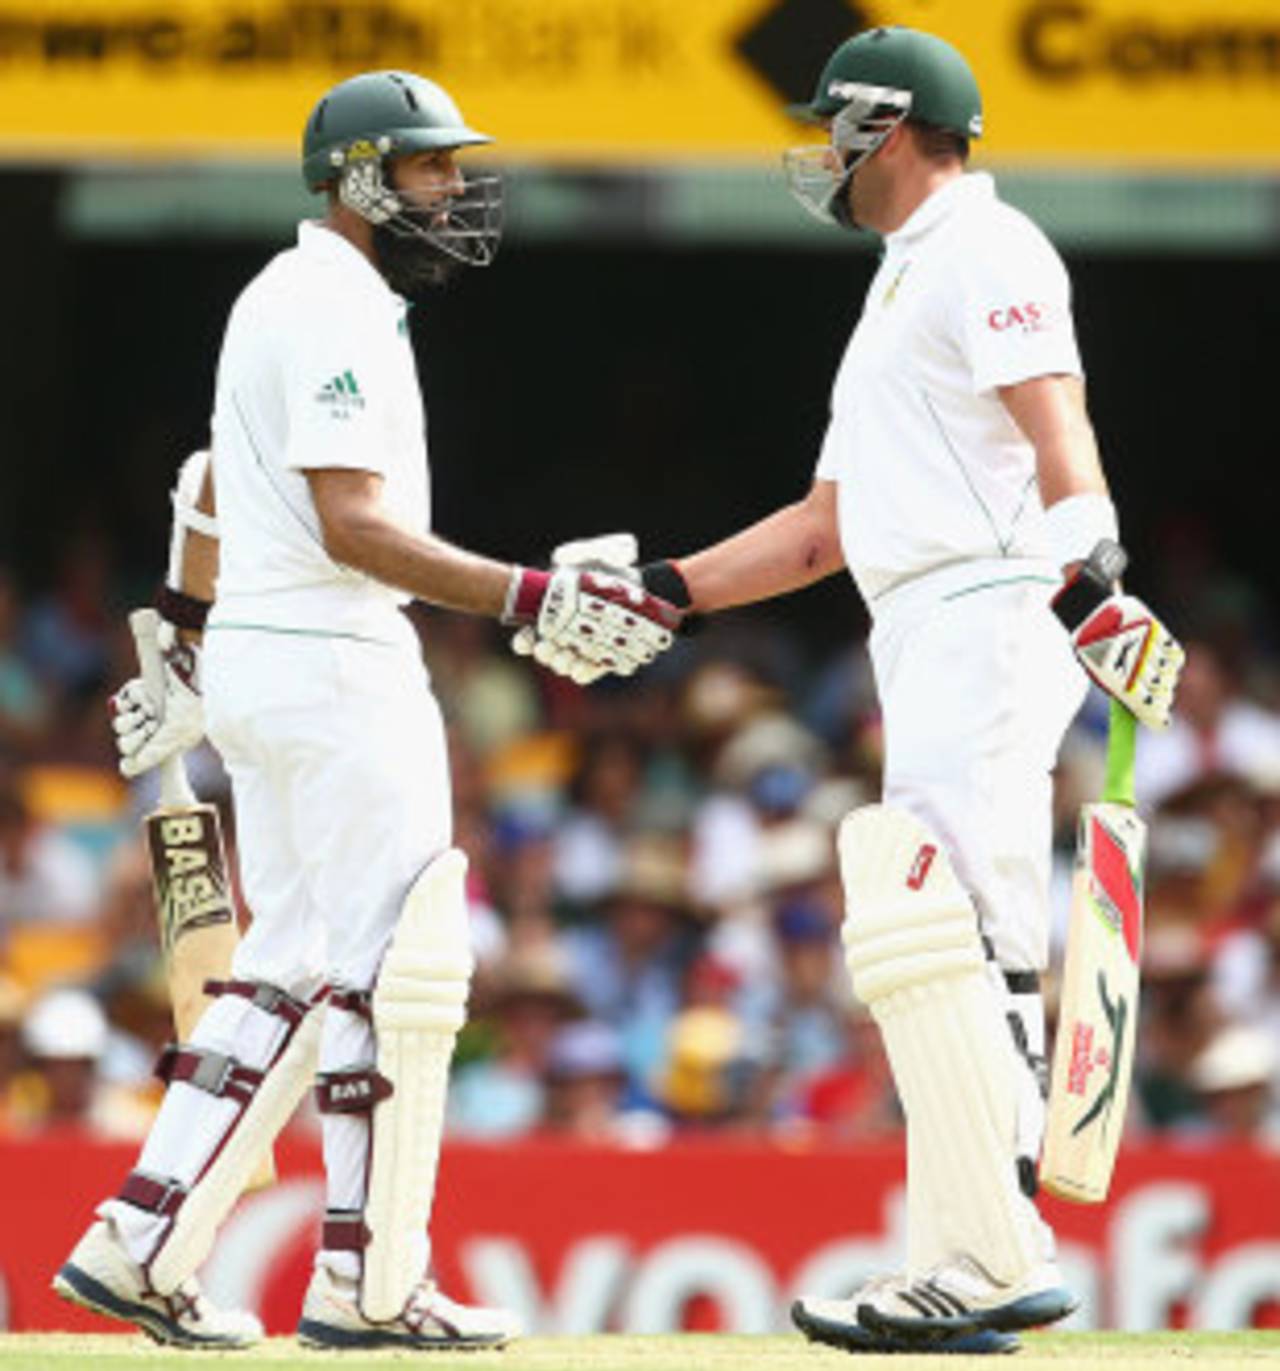
The recent form of Hashim Amla and Jacques Kallis provides South Africa with a distinct advantage on the batting front • Getty Images
At first glance, South Africa, the No. 1 Test team, seem clear favourites in the upcoming series against Pakistan. Since the beginning of 2008, South Africa have lost only one series at home and won twice in Australia and England.
Pakistan, on the other hand, have had a mixed bag of results in the same period. They were beaten convincingly in Australia (2009-10) and England (2010) but turned their fortunes around by beating England 3-0 in the UAE at the beginning of 2012. However, given Pakistan's unpredictability, the result of the series is hard to predict. On their previous tour of South Africa in 2006-07, Pakistan won the second Test and missed out on a great chance to register a series win in the third Test in Cape Town. The variety in Pakistan's bowling will test the hosts but the visitors' batting frailties are just as likely to be exposed against a top-quality attack in pace-friendly conditions.
Pakistan played their first Test against South Africa in Johannesburg in 1995 and lost by a huge margin of 324 runs. South Africa also won their first series in Pakistan in 1997 but were upstaged in Durban (1998) by 29 runs in a low-scoring game. Pakistan's next win in South Africa came in 2006-07 when they won by five wickets in Port Elizabeth. Overall, South Africa have the superior head-to-head record winning eight Tests and losing three. In the previous series played between the two teams, both matches ended in high-scoring draws as the South African pace bowlers struggled to bowl out Pakistan on flat tracks in the UAE. The visitors, looking to become the most successful subcontinent team in South Africa, will draw confidence from the fact that their varied bowling attack was a major factor behind both their wins in South Africa.
| Played | Wins | Losses | Draws | W/L ratio | |
| Overall | 18 | 3 | 8 | 7 | 0.37 |
| Home | 7 | 1 | 2 | 4 | 0.50 |
| Away | 9 | 2 | 6 | 1 | 0.33 |
| Neutral | 2 | 0 | 0 | 2 | - |
As has been the case with all subcontinent teams, Pakistan have also struggled on the batting front in South Africa. In five Tests played in South Africa since 2000, Pakistan average 24.24 with the bat while the hosts average a much higher 37.66. Both teams, however, have the same number of centuries (4) while South Africa have a higher number of five-wicket hauls (3). In the same period, the teams have played each other four times in Pakistan winning one Test each. At home, Pakistan have a much better batting average (35.98) compared to their performance in South Africa. The average difference (difference between Pakistan's batting average and bowling average) at home (-2.04) is significantly better than the corresponding number in Tests in South Africa (-13.42). South Africa also batted and bowled Pakistan in the two Tests played in the UAE in 2010 but were unable to emerge with a win. Overall, South Africa have a superior average (41.00) and more centuries (14) and five-fors (8).
| Matches | Wins/Losses | Bat avg | Bowl avg | Avg diff | 100s (Pak/SA) | 5WI(Pak/SA) | |
| Tests in South Africa | 5 | 1/4 | 24.24 | 37.66 | -13.42 | 4/4 | 1/3 |
| Tests in Pakistan | 4 | 1/1 | 35.98 | 38.02 | -2.04 | 1/5 | 2/4 |
| Tests in UAE | 2 | 0/0 | 45.30 | 57.11 | -11.81 | 1/5 | 1/1 |
| Overall | 11 | 2/5 | 31.21 | 41.00 | -9.79 | 6/14 | 4/8 |
Pakistan's greatest strength over the years has been their bowling attack. A top-class pace/spin combination has consistently given them opportunities to win Tests abroad. Since 2010, South Africa, unsurprisingly, have had the best numbers for pace bowlers. In 28 matches, South Africa's fast bowlers have picked up 384 wickets (wickets per match 13.71) at an excellent average of 25.95. In contrast, their spinners have picked up 81 wickets at a much higher average of 45.97. Pakistan fast bowlers, who have picked up 221 wickets in 26 Tests, have the fourth-best average (30.30) behind those of South Africa, Australia and England. However, they have the best average on the spin front. Saeed Ajmal, who has picked up 104 wickets in his last 18 Tests, has the best average (24.47) and strike rate (58.3) among spinners in Tests since 2010 (min 50 wickets). The narrow difference (1.76) between averages of Pakistan spinners and pace bowlers is bettered only by England, who have a corresponding number of 0.95.
| Team | Matches | Pace (wickets/avg) | Pace (5WI) | Spin (wickets/avg) | Spin (5WI) |
| South Africa | 28 | 384/25.95 | 22 | 81/45.97 | 0 |
| Australia | 33 | 427/28.16 | 20 | 118/37.11 | 5 |
| England | 37 | 417/29.19 | 14 | 199/30.14 | 14 |
| Pakistan | 26 | 221/30.30 | 9 | 221/28.44 | 9 |
| West Indies | 26 | 229/32.55 | 11 | 143/39.15 | 5 |
| New Zealand | 23 | 218/35.75 | 8 | 79/48.51 | 2 |
| India | 35 | 260/37.26 | 7 | 268/37.80 | 12 |
| Sri Lanka | 28 | 148/52.57 | 3 | 209/32.05 | 13 |
The hosts' outstanding batting strength can be gauged from the fact their batting line-up possesses three of the five batsmen who average more than 60 (2000-plus runs) since 2010. Only Alastair Cook has scored more centuries (13) than Hashim Amla and Jacques Kallis, who have scored 12 centuries each. While Amla and Kallis have more centuries than fifties, AB de Villiers has struggled to convert his half-centuries to three-figure scores. While Graeme Smith, who is set to become the first player to lead in a 100 Tests, has scored over 2000 runs at an average of 48.28, his opening partner Alviro Petersen, has been less successful scoring 1514 runs at 42.05.
As expected, both Amla and Kallis have excellent numbers against pace and spin. While Amla has slightly better values of average and balls-per-dismissal against pace, Kallis has the better numbers against spinners. De Villiers has comparatively lower numbers against pace bowling but outperforms Kallis and Amla against spin. While Smith has fairly even stats against fast and slow bowling, Petersen has struggled against spin with an average of 29.41 and a balls-per-dismissal value of 65.58.
| Batsman | Matches | Runs | Average | 100/50 | Pace (avg/balls per dismissal) | Spin (avg, balls per dismissal) |
| Hashim Amla | 28 | 2912 | 69.33 | 12/10 | 74.88/125.84 | 68.92/139.14 |
| Jacques Kallis | 27 | 2569 | 67.60 | 12/5 | 64.47/121.56 | 77.00/132.42 |
| AB de Villiers | 28 | 2306 | 62.32 | 5/12 | 54.52/93.24 | 85.00/157.54 |
| Graeme Smith | 28 | 2173 | 48.28 | 8/10 | 47.96/79.63 | 47.08/96.25 |
| Alviro Petersen | 21 | 1514 | 42.05 | 5/5 | 50.43/92.95 | 29.41/65.58 |
Younis Khan, who has scored three centuries in his last four Tests against South Africa, averages nearly 60 since the beginning of 2010. He also played a pivotal role in Pakistan's win in Port Elizabeth in 2006. Azhar Ali, who is the highest run-getter for Pakistan in the same period, averages 45.27 with four centuries and 13 fifties. Misbah-ul-Haq, Pakistan's captain, averages 58.60 but has a very poor ratio of centuries to fifties (1:13). Mohammad Hafeez, who has scored three centuries at an average of 41.35, is likely to be partnered at the top of the order by Taufeeq Umar or Nasir Jamshed.
Both Younis and Azhar have very similar stats against fast bowlers. Against spinners, however, Younis has been the better player; he averages 75.50 and has a balls-per-dismissal value of 149.40 while Azhar has corresponding numbers of 47.80 and 141.00. While Misbah has very good numbers against pace and spin, Hafeez and Taufeeq have had their struggles especially against spin (averages 34.92 and 35.90 respectively).
| Batsman | Matches | Runs | Average | 100/50 | Pace (avg/balls per smissal) | Spin (avg/balls per dismissal) |
| Azhar Ali | 24 | 1811 | 45.27 | 4/13 | 43.76/96.76 | 47.80/141.00 |
| Younis Khan | 16 | 1305 | 59.31 | 4/5 | 45.83/96.83 | 75.50/149.40 |
| Misbah-ul-Haq | 18 | 1287 | 58.50 | 1/13 | 67.77/169.66 | 52.07/111.53 |
| Mohammad Hafeez | 18 | 1282 | 41.35 | 3/5 | 46.00/74.33 | 34.92/61.84 |
| Taufeeq Umar | 18 | 1214 | 37.93 | 3/5 | 39.00/81.90 | 35.90/91.45 |
Since 2010, both South Africa and Pakistan have had five century opening stands but the hosts average higher. Similarly, for the second wicket, South Africa have a higher average but the same number of century partnerships (8). With Amla and Kallis have been in top form, South Africa average a superb 76.11 (ten century stands) for the third wicket. In contrast, Pakistan have struggled averaging just 33.43 (two century stands). The hosts' dominance extends to the fourth-wicket partnership as well but the trend is reversed for the fifth wicket. Pakistan have more centuries (7) and a higher average (47.48) than the hosts. However, South Africa are by far the better team in terms of averages for wickets 6-10.
| Wicket | SA (Innings) | SA (Runs/avg) | SA (100/50 stands) | Pakistan (Innings) | Pakistan (Runs/avg) | Pakistan (100/50 stands) |
| 1 | 49 | 2038/42.45 | 5/9 | 51 | 1710/34.89 | 5/9 |
| 2 | 48 | 2677/56.95 | 8/8 | 49 | 2271/48.31 | 8/10 |
| 3 | 47 | 3349/76.11 | 10/11 | 47 | 1538/33.43 | 2/7 |
| 4 | 43 | 2307/56.26 | 8/8 | 46 | 1883/44.83 | 6/7 |
| 5 | 40 | 1323/34.81 | 3/7 | 42 | 1947/47.48 | 7/9 |
| 6 | 38 | 1587/45.34 | 5/9 | 42 | 757/19.41 | 0/3 |
| 7 | 35 | 898/27.21 | 1/7 | 38 | 819/23.40 | 0/7 |
| 8-10 | 87 | 1934/23.30 | 1/10 | 102 | 1517/15.17 | 1/5 |
In Johannesburg, the venue for the first Test, teams batting first have had no significant advantage, winning and losing two matches each. However, in Cape Town and Centurion, teams batting first have struggled badly winning just one and losing 11 Tests. The first-innings average is the highest in Cape Town (30.77) and lowest in Centurion (25.16). While the second-innings averages in Johannesburg and Cape Town are not much higher than the corresponding first-innings numbers, the difference is massive in Centurion (second-innings average of 48.44).
Both Centurion and Cape Town have third-innings averages below 30 while Johannesburg has a corresponding average of 34.45. Cape Town, which has shown a trend to ease out as the match progresses, has a fourth-innings average of 46.59 while the other two venues have averages of 28.62 and 35.58 respectively. Pace bowlers have picked up the highest percentage of wickets (bowler wickets only) in Johannesburg (84.55%) followed by Centurion (79.76%). Despite picking up very few wickets, spinners have the best average at the Wanderers (33.85) followed by Cape Town (37.93).
| Venue | Matches | Result% | Bat first (wins/losses) | Avg (1st inns/2nd inns) | Avg (3rd inns/4th inns) | Pace (wkts/avg) | Spin (wkts/avg) |
| Johannesburg | 4 | 100 | 2/2 | 28.45/28.56 | 34.45/28.62 | 115/28.34 | 21/33.85 |
| Cape Town | 9 | 83.3 | 1/6 | 30.77/32.35 | 28.63/46.59 | 217/30.28 | 60/37.93 |
| Centurion | 6 | 77.7 | 0/5 | 25.16/48.44 | 26.41/35.58 | 138/31.87 | 35/40.57 |
Madhusudhan Ramakrishnan is a sub-editor (stats) at ESPNcricinfo