Australia's strongest venue
Stats highlights to the first Test between Australia and West Indies in Brisbane
S Rajesh
25-Nov-2009
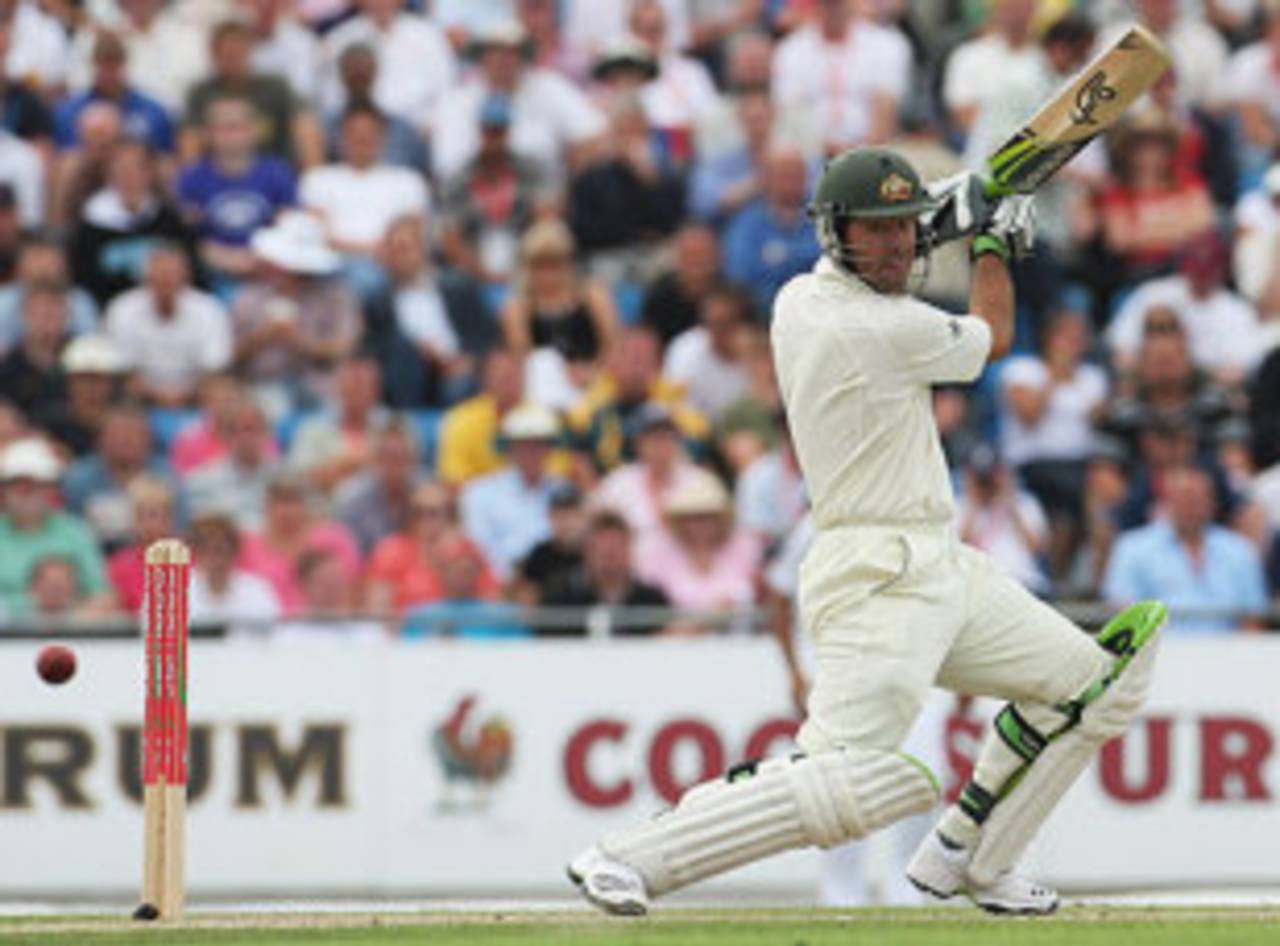
Ricky Ponting has scored more Test runs at the Gabba than any other batsman • Getty Images
For an Australian team which has struggled to impose themselves in Test cricket of late, the three-match home series against West Indies is an excellent opportunity to get back to their winning ways. On paper, the gulf between the two teams is huge: West Indies have lost each of their eight Tests in Australia since 2000, two by an innings and two more by 350-plus runs. Australia's Test form has been patchy recently - they've lost three of their last five series - but they've won six of their last seven series against West Indies, and drawn the other. The last time West Indies triumphed was in 1992, when they edged to a 2-1 series win.
Australia's form at the Gabba, the venue for the first Test, is even more imposing. Since 1990, they've won 15 out of 19 Tests there, and drawn the other four. Most of those wins have been convincing ones - five by an innings, two by ten wickets, and three more by more than 250 runs. West Indies were one of the four teams to manage a draw, though they were lucky to escape: chasing 231 for victory, they struggled to 133 for 8.
West Indies were also the last team to beat Australia at this ground, winning by eight wickets in 1988, but since 1990 they've lost three out of four times.
| Tests | Won | Lost | Drawn | |
| Aus at the Gabba since 1990 | 19 | 15 | 0 | 4 |
| WI at the Gabba since 1990 | 4 | 0 | 3 | 1 |
In fact, Australia have been more dominant at the Gabba than at any other home venue. In 51 matches they've won 31 and lost only eight - three of those to West Indies - giving them a win-loss ratio of 3.87. Their next best record is in Perth, the venue for the third Test, where they've won 20 and lost nine.
| Venue | Tests | Won | Lost | Ratio |
| The Gabba, Brisbane | 51 | 31 | 8 | 3.87 |
| WACA, Perth | 36 | 20 | 9 | 2.22 |
| Adelaide Oval | 67 | 34 | 16 | 2.12 |
| MCG, Melbourne | 101 | 57 | 29 | 1.96 |
| SCG, ,Sydney | 97 | 53 | 27 | 1.96 |
The table below shows the vast difference between the performances of the two teams at this ground since 1990. The Australian batsmen have an overall average of more than 45, with 31 centuries in 19 Tests. Their bowlers average almost half the batsmen's average, which indicates Australia have been almost twice as good as their opposition at this ground. West Indies, on the other hand, average a miserable 19.26 per wicket with the bat, and more than 42 with the ball. That explains the margins of defeat in their last two Tests here - an innings and 126 runs, and 379 runs.
| Team | Tests | Bat ave | 100s/ 50s | Bowl ave | 5WI/ 10WM |
| Australia | 19 | 45.50 | 31/ 50 | 23.71 | 15/ 3 |
| West Indies | 4 | 19.26 | 3/ 5 | 42.40 | 1/ 0 |
Most of the Australian batsmen in the current squad have pretty good numbers at the Gabba. Michael Clarke leads in terms of averages with 468 runs in five Tests, while Ricky Ponting has scored 1141 runs, the most by any batsman here, in 13 matches. Simon Katich and Michael Hussey have played pretty well too, but Shane Watson has only managed 22 in three innings.
| Batsman | Tests | Runs | Average | 100s/ 50s |
| Michael Clarke | 5 | 468 | 93.60 | 2/ 2 |
| Ricky Ponting | 13 | 1141 | 67.11 | 4/ 7 |
| Simon Katich | 3 | 157 | 52.33 | 1/ 0 |
| Michael Hussey | 4 | 284 | 47.33 | 1/ 1 |
| Shane Watson | 2 | 22 | 7.33 | 0/ 0 |
Among the Australian bowlers in the current squad, only Mitchell Johnson has played Tests here. In two Tests he has taken 13 wickets, including a match haul of 9 for 69 against New Zealand last year.
It hasn't been such a happy venue for West Indies, though. Only three batsmen from the current squad have played Tests here, and none of them average 40. Shivnarine Chanderpaul has the best figures, with two half-centuries and an average of 37 in three Tests. Ramnaresh Sarwan bagged a pair in his first Test there, but managed 52 runs in two innings in 2005. In fact even Brian Lara couldn't come to terms with the conditions in Brisbane - in eight innings there, he managed one half-century and an average of 22.
| Batsman | Tests | Runs | Average | 100s/ 50s |
| Shivnarine Chanderpaul | 3 | 185 | 37.00 | 0/ 2 |
| Chris Gayle | 1 | 43 | 21.50 | 0/ 0 |
| Ramnaresh Sarwan | 2 | 52 | 13.00 | 0/ 0 |
S Rajesh is stats editor of Cricinfo