Trick of the tail, and neutralising Cook
India's flourishing eight-wicket partnerships, Cook's struggles against Jadeja, and other statstical highlights from India's 4-0 win
S Rajesh
21-Dec-2016
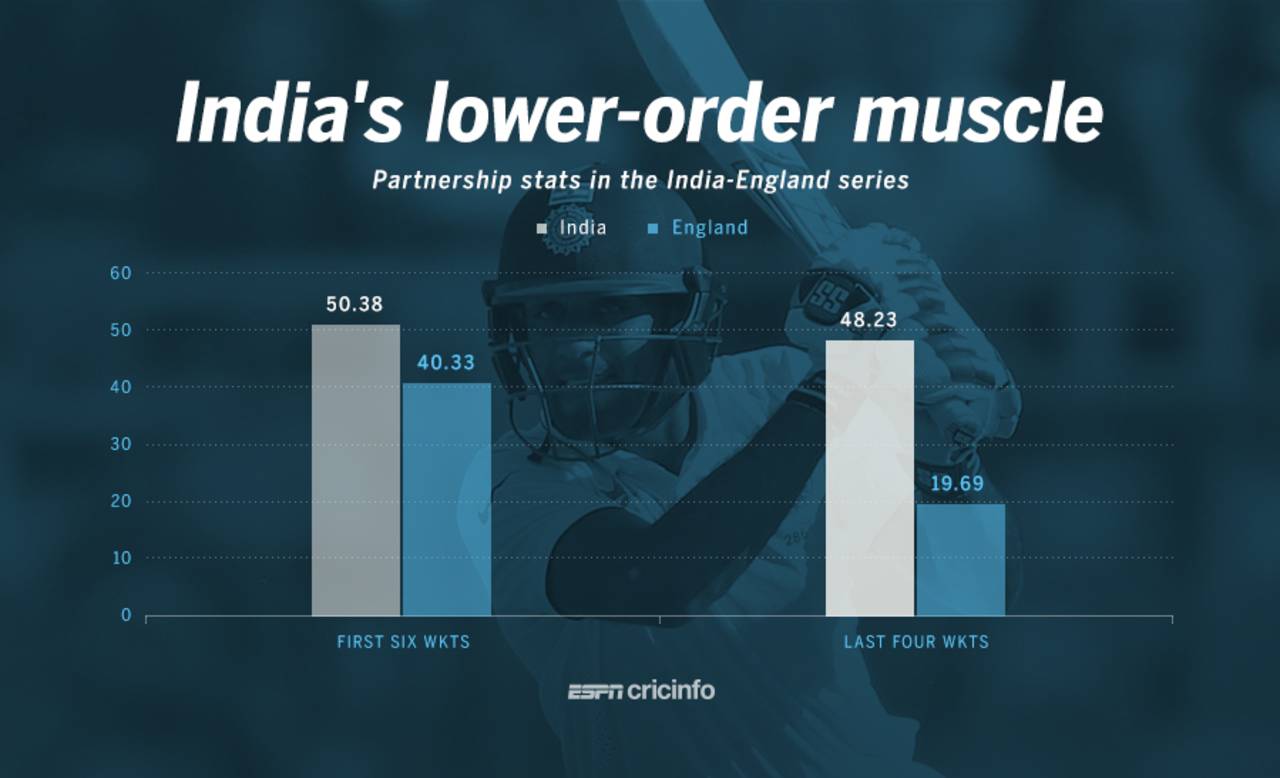
India's lower order batsmen comfortably outdid England's in the series • ESPNcricinfo Ltd
The lower-order difference
With Virat Kohli in imperious form, and Cheteshwar Pujara and M Vijay chipping in consistently, India's top order was in reasonable shape throughout the series. But the big difference between the teams was the lower-order contributions. Led by Jayant Yadav, R Ashwin and Ravindra Jadeja, India's last four wickets averaged 48.23 runs per completed partnership, while England's average was less than half that value. England's lower order has generally been strong over the last few series, but this time they were clearly second best. Going into the last Test, the difference in top-order averages was minimal - 42.13 for India, 40.13 for England - but India were still 3-0 up in the series, thanks to the lower order.
In terms of wicket-wise numbers, India's second and third-wicket partnerships stood out, but their highest partnership average of 85 was for the eighth wicket, thanks to the 241-run stand between Kohli and Jayant in Mumbai, which was also the highest stand of the series. With a cut-off of five partnerships, there have only been two instances of a higher average stand for the eighth wicket: Pakistan versus England in 2010 (average 85.66) and South Africa versus India in 1996-97 (average 85.25).
In contrast, the only wicket for which England had a 50-plus average was the first wicket, with England averaging 57.50, thanks to the runs accumulated by Haseeb Hameed, Keaton Jennings and Alastair Cook.
| India | England | |||||
| For wkt | Runs | Ave | 100s | Runs | Ave | 100s |
| 1st | 327 | 40.87 | 1 | 575 | 57.50 | 2 |
| 2nd | 524 | 65.50 | 2 | 231 | 23.10 | 0 |
| 3rd | 548 | 78.28 | 2 | 413 | 41.30 | 1 |
| 4th | 331 | 47.28 | 1 | 420 | 46.66 | 1 |
| 5th | 215 | 30.71 | 0 | 289 | 32.11 | 0 |
| 6th | 272 | 38.85 | 1 | 371 | 41.22 | 1 |
| 7th | 417 | 69.50 | 1 | 198 | 22.00 | 0 |
| 8th | 425 | 85.00 | 1 | 218 | 24.22 | 1 |
| 9th | 66 | 13.20 | 0 | 181 | 20.11 | 0 |
| 10th | 105 | 21.00 | 0 | 112 | 12.44 | 0 |
India turn the spin table
In 2012-13, led by two champions in Monty Panesar and Graeme Swann, England's spinners comfortably outdid India's: they took four fewer wickets than their Indian counterparts (39 to India's 43), but had a far superior average (28.61 as opposed to 40.62). This time, England's spin armoury, led by Adil Rashid and Moeen Ali, was no match for Ashwin, Jadeja and Jayant. India's spinners took 28 wickets more than their England counterparts, and had a much better average as well - 30.35 as against 48.10. England's spinners were far too profligate, going at 3.55 runs per over and conceding a boundary every 16 balls, compared to India's spinners who conceded 2.73 per over, and a boundary every 22 balls.
Neutralising Alastair Cook
During his previous visit to India, Cook hurt India almost every time he came out to bat, scoring three hundreds in his first five innings, including two scores in excess of 175. Not only did he score 562 runs in eight innings, his presence at the crease also allowed England's strokeplayers to express themselves more freely. In that series, 52% of England's runs were scored when Cook was at the crease; in the first three Tests of that series, that percentage was as high as 70.
Even in the best-case scenario, Cook would have been hard-pressed to repeat that performance, but in this series, his aggregate of 369 from ten innings was a disappointment. Only 25% of England's total runs in this series were scored when Cook was at the crease.
Cook's strike rates in the two series were remarkably similar, but all the other numbers that mattered were hugely different.
| Series | Innings | Runs | Average | 100s | SR | % runs* |
| In 2012-13 | 8 | 562 | 80.28 | 3 | 43.73 | 52.03 |
| In 2016-17 | 10 | 369 | 36.90 | 1 | 43.92 | 24.66 |
Cook v Jadeja
When the series began, much of the talk centred around how Cook would tackle the threat of Ashwin, who was in the form of his life. As it turned out, the biggest threat came not from Ashwin, but the left-arm spin of Ravindra Jadeja. Jadeja dismissed Cook six times, the most Cook has ever fallen to one bowler in a series.
Ashwin didn't do too badly against Cook either, dismissing him three times for 93 runs. But Jadeja's stats stand out especially in light of Cook's mastery over left-arm spin in 2012 when he scored 159 runs against them - 147 off Pragyan Ojha - and was dismissed just once. In this series, Jadeja dismissed him six times, conceding only 75 runs. The contrast couldn't be any starker.
The Virat Kohli factor
In the first four Tests, Virat Kohli's runs were one of the big differences between the two teams. With him, India's top seven averaged 43.55 as opposed to England's 38.13; without him, India's top seven averaged 32.45 in those four Tests, well below England's top order. Karun Nair and KL Rahul lifted that average significantly in the last Test, but when the series was alive with everything to play for, it was Kohli's runs that made the difference.
| Team | Innings | Runs | Average | 100s |
| India | 46 | 1873 | 43.55 | 6 |
| India, minus Kohli | 39 | 1233 | 32.45 | 4 |
| England | 53 | 1945 | 38.13 | 5 |
India's all-round strength
Not only were Ashwin and Jadeja stellar with the ball, they also contributed consistently down the order. Both scored 200-plus runs and took 20-plus wickets, making this only the fourth instance of two players from a team achieving that in a series, and the first for India. Ashwin became the first Indian, and fifth allrounder ever, to achieve the double of 300-plus runs and 25-plus wickets in a series. Before Ashwin, the last player to do so was Ian Botham in the historic 1981 Ashes series.
Add Jayant Yadav's contributions, and it ensured that India were effectively playing with 12 members, even as England's selection issues often meant they were effectively playing with 10 players.
| Team | Series | Players |
| India | v England, 2016-17 | R Ashwin, Ravindra jadeja |
| South Africa | v West Indies, 2000-01 | Shaun Pollock, Jacques Kallis |
| England | v Australia, 1978-79 | Ian Botham, Geoff Miller |
| Australia | v West Indies, 1951-52 | Keith Miller, Ray Lindwall |
| Player | ||||||
| R Ashwin (INDIA) | v England, 2016-17 | 5 | 306 | 43.71 | 28 | 30.25 |
| Ian Botham (ENG) | v Australia, 1981 | 6 | 399 | 36.27 | 34 | 20.58 |
| Richie Benaud (AUS) | v South Africa, 1957-58 | 5 | 329 | 54.83 | 30 | 21.93 |
| Aubrey Faulkner (SA) | v England, 1909-10 | 5 | 545 | 60.55 | 29 | 21.89 |
| George Giffen (AUS) | v England, 1894-95 | 5 | 475 | 52.77 | 34 | 24.11 |
More numbers from the series
1977-78 The last time a five-Test series with fewer than two draws consumed more deliveries than the 11,938 bowled in this series (1989.4 overs): in 1977-78, Australia's 3-2 series win against India consumed 12,483 balls (2080.3 six-ball overs).
4 Number of times India's first-innings total exceeded 400 despite losing the toss, the first time any team has achieved this so many times in a series.
11 Batsmen who scored hundreds in the series - six for India and five for England. Only once have more batsmen scored hundreds in a series: there were 12 when Australia toured West Indies in 1955. There have only been three previous instances of six centurions for India in a series.
2 Instances of England scoring 400 or more in their first innings and losing by an innings in this series: in Mumbai and in Chennai. There have only been six such instances in Test history, and England have been at the receiving end four times.
S Rajesh is stats editor of ESPNcricinfo. @rajeshstats