107 sixes, 345 fours, nine hundreds
Stats highlights from a relentless run-fest between India and Australia
S Rajesh
04-Nov-2013
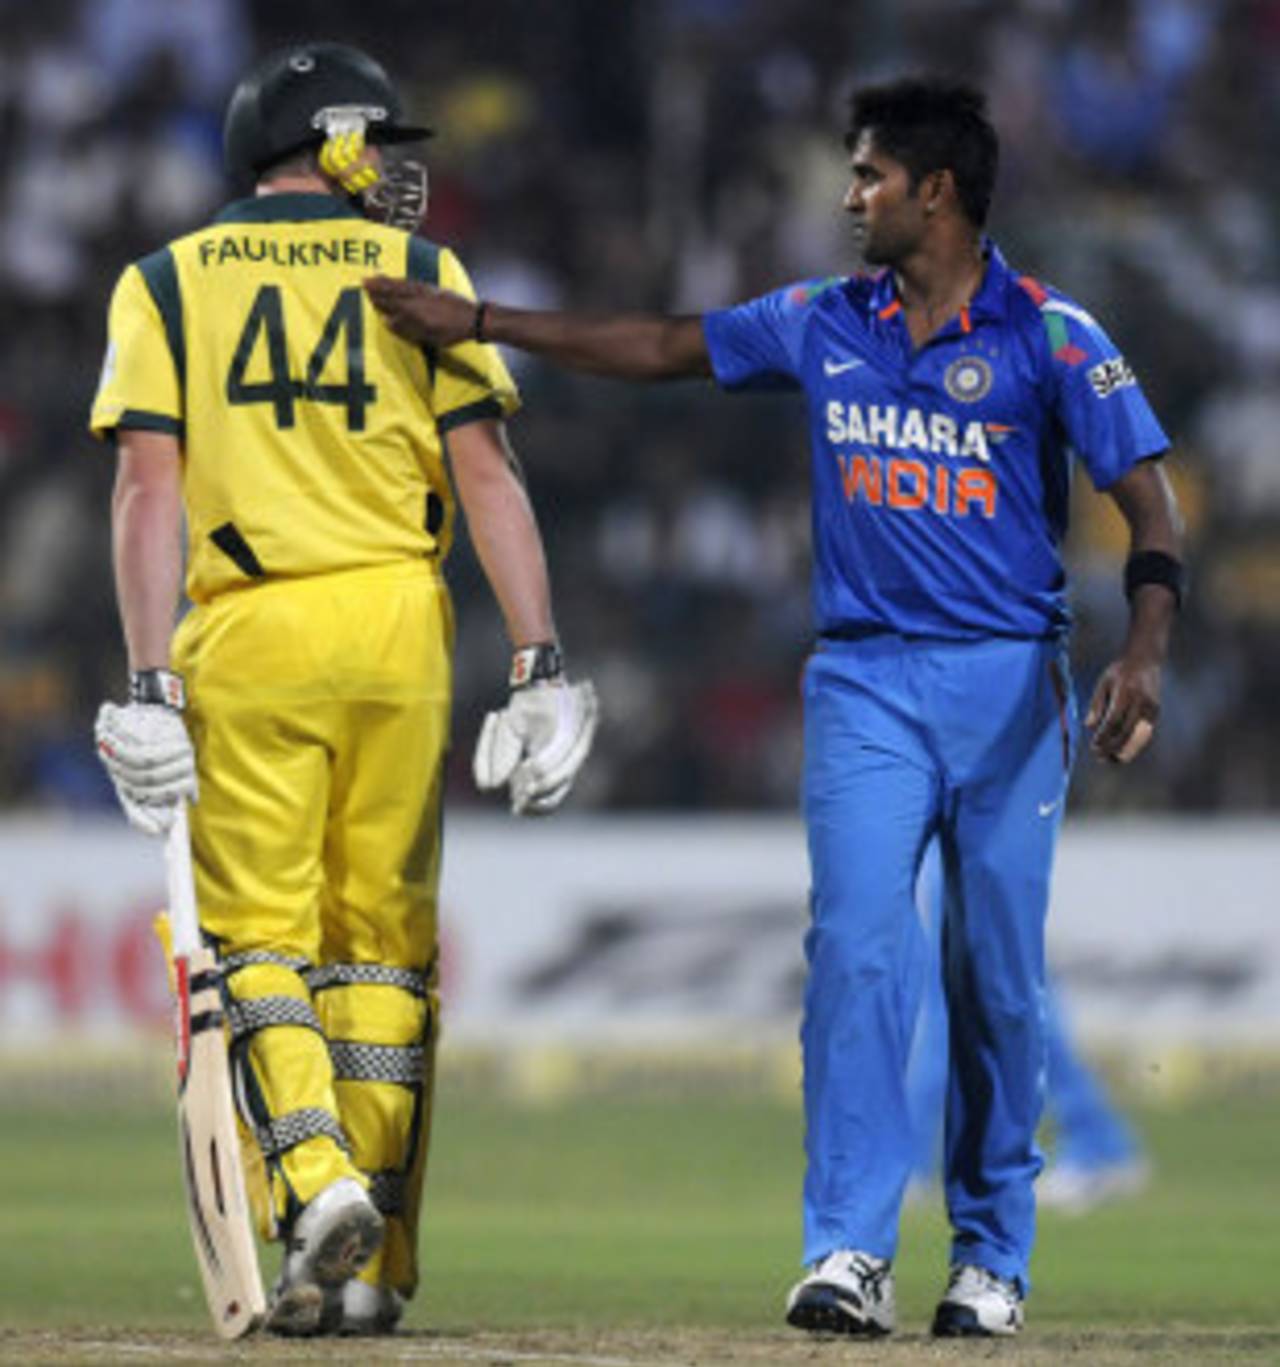
Vinay Kumar became the first bowler to concede more than 100 runs in an ODI and yet end up on the winning side • BCCI
- A total of 3596 runs were scored in the six ODIs between India and Australia, for the loss of 73 wickets in 541.3 overs - a run rate of 6.64 per over, and an average of 49.26 per wicket. In all ODI series - bilateral and otherwise - in which at least two matches have been played, never has such a high scoring rate been achieved: the previous-best was 6.62, when India toured New Zealand in 2009. The top four series in terms of run rates have all involved India.
| Period of inngs | Runs | Balls | Dismissals | Average | Run rate | 4s/ 6s |
| Mandatory Powerplay | 609 | 685 | 8 | 76.12 | 5.33 | 90/ 2 |
| Batting Powerplay | 432 | 330 | 13 | 33.23 | 7.85 | 44/ 16 |
| Rest of the innings | 2555 | 2234 | 52 | 49.13 | 6.86 | 211/ 89 |
| Over No. | Runs | Balls | Dismissals | Run rate | 4s/ 6s |
| 48 | 135 | 54 | 1 | 15.00 | 11/ 10 |
| 50 | 103 | 46 | 7 | 13.43 | 9/ 6 |
| 47 | 101 | 54 | 1 | 11.22 | 9/ 5 |
| 49 | 86 | 54 | 3 | 9.55 | 8/ 3 |
| 44 | 99 | 63 | 0 | 9.42 | 10/ 4 |
| 25 | 100 | 66 | 0 | 9.09 | 6/ 7 |
| 38 | 95 | 66 | 3 | 8.63 | 8/ 4 |
| 37 | 94 | 66 | 2 | 8.54 | 9/ 3 |
| 28 | 92 | 66 | 2 | 8.36 | 3/ 6 |
| 46 | 76 | 55 | 2 | 8.29 | 7/ 2 |
S Rajesh is stats editor of ESPNcricinfo. Follow him on Twitter