Marsh, Watson, and several other stars
The IPL wasn't timed perfectly for those who were in the national Australian team, but despite that handicap, the Australians made their presence felt quite amply in the 2008 tournament
S Rajesh
16-Apr-2009
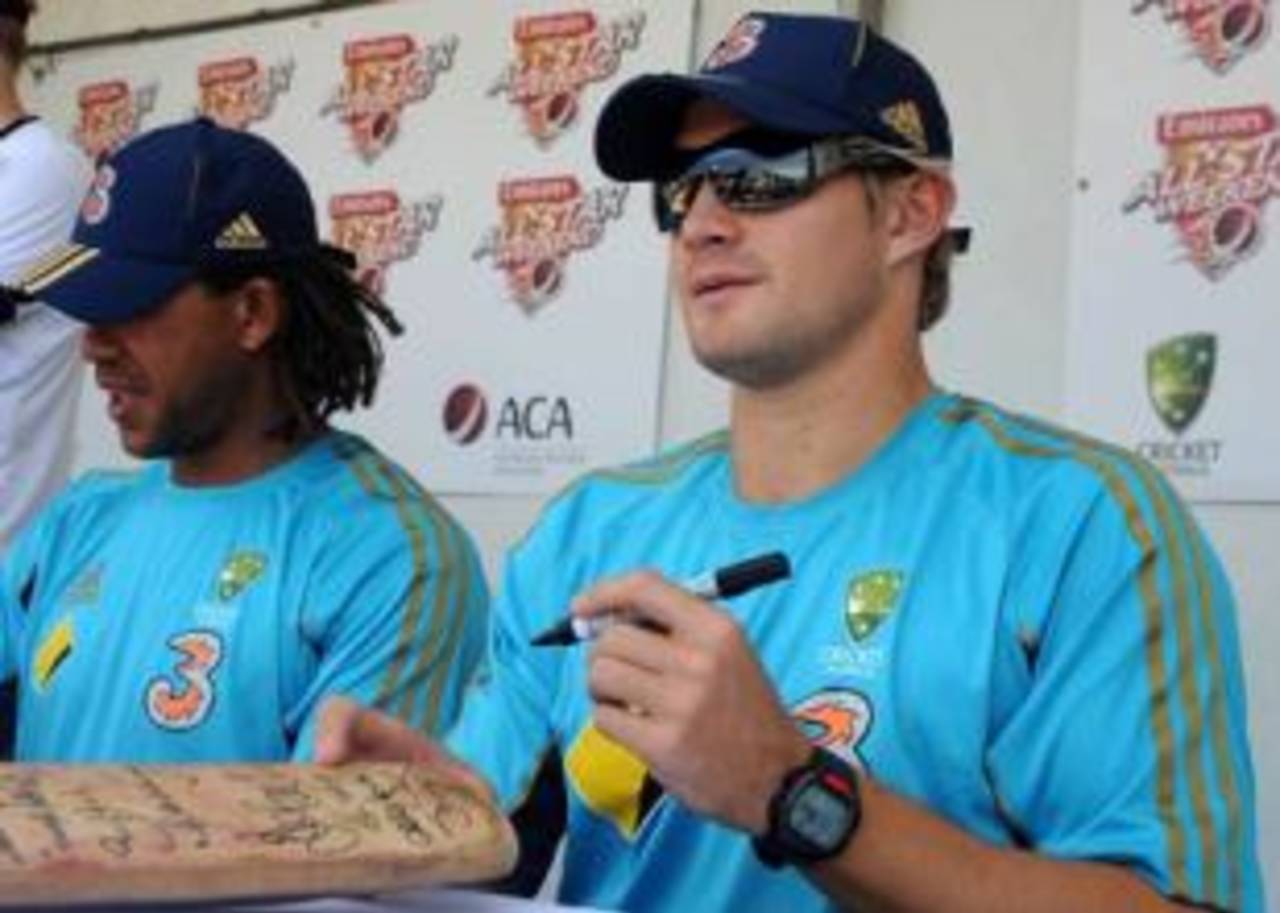
Shane Watson shone with both bat and ball in IPL 2008, but Andrew Symonds had a terrible time as a bowler • Getty Images
The IPL wasn't timed perfectly for those who were in the national Australian team, but despite that handicap, the Australians made their presence felt quite amply in the 2008 tournament. The leading run-scorer came from that country, as did the second-highest wicket-taker and the best allrounder.
Even those who were around very briefly made their presence felt, with Matthew Hayden, Michael Hussey and Simon Katich all scoring plenty of runs in the few games they played. Ricky Ponting didn't achieve the same kind of success, but overall the Australian success was especially pronounced with the bat: the 20 players who batted managed a combined average of 37.48 runs per dismissal, at a strike-rate of 8.15 runs per over. Both were better than the tournament average, with the runs per wicket being considerably better than the IPL mean of 25.97.
| Total runs* | Average | Runs per over | Aus runs* | Average | Runs per over | |
| IPL season 2008 | 16,808 | 25.97 | 7.73 | 3186 | 37.48 | 8.15 |
While the firepower of Marsh, Watson, Pommersbach, Gilchrist, and several others ensured that the batting stats for Australia were well above par, it wasn't quite the same with their bowlers. There were three outstanding names in that list, with Watson, Shane Warne and Glenn McGrath being among the best bowlers in the tournament, but there were others who pulled the overall averages down: Andrew Symonds was the worst of the lot, leaking 101 in 41 deliveries without taking a wicket for the Deccan Chargers, while Brett Geeves (91 runs in 48 balls for one wicket) and James Hopes (276 runs in 168 balls for seven wickets) were among those who felt the heat. Cameron White had an 'economy' rate of 24 runs per over, but thankfully, he only bowled one over for Bangalore Royal Challengers, conceding two fours and two sixes in six deliveries.
| Total wickets* | Average | Econ rate | Aus wickets* | Average | Econ rate | |
| IPL season 2008 | 604 | 28.95 | 8.10 | 66 | 29.66 | 8.02 |
The team that benefited most from the Australian batsmen in the 2008 IPL was Kings XI Punjab. Apart from Marsh, who scored 616 runs in the tournament, they also had Pommersbach (152 runs in five innings), Hopes (221 in 11) and Katich (96 in two). In fact, the top three for the team, in terms of averages, were all Australians.
The Australian contribution for Punjab was almost twice the next best team, the Deccan Chargers. The side finished at the bottom of the pile, but in terms of averages Symonds, who scored 161 from 105 balls in his three innings - and Gilchrist finished among the top four, with Gilchrist aggregating 436 from 14 innings. Rajasthan Royals were next in terms of Australian contribution, thanks almost entirely to Watson, who scored 472 runs at an average of 47.20 and a strike rate of 151.76.
If Punjab were at the top of the table, their northern neighbours Delhi brought up the rear in terms of Australian contribution with the bat. Their only Australian representatives were McGrath and Geeves, neither of whom is a powerhouse with the bat. Geeves didn't bat at all in the tournament, while McGrath scored a grand total of four runs in his three innings.
| Team | Total runs | Average | Runs per over | Aus runs | Average | Runs per over |
| Kings XI Punjab | 2340 | 31.62 | 8.33 | 1102 | 47.91 | 8.58 |
| Deccan Chargers | 2117 | 23.52 | 7.80 | 597 | 39.80 | 8.46 |
| Rajasthan Royals | 2424 | 30.30 | 8.07 | 560 | 35.00 | 8.65 |
| Kolkata Knight Riders | 1801 | 21.44 | 7.19 | 370 | 23.12 | 6.74 |
| Chennai Super Kings | 2364 | 31.10 | 7.87 | 357 | 89.25 | 9.27 |
| Bangalore Royal Challengers | 1865 | 19.03 | 6.97 | 123 | 20.50 | 6.58 |
| Mumbai Indians | 1897 | 25.98 | 7.54 | 73 | 18.25 | 5.15 |
| Delhi Daredevils | 2000 | 27.77 | 7.98 | 4 | 4.00 | 4.80 |
With Warne and Watson in splendid form with the ball, the Australians contributed plenty to Rajasthan's bowling success. Though Sohail Tanvir was the leading wicket-taker with 22, Warne (19) and Watson (17) contributed 36 wickets at an average of less than 22. Delhi were next, thanks largely to McGrath, who finished the tournament with an outstanding economy rate of 6.61. Punjab had a reasonable amount of Australian contribution as well, but the teams from the southern parts of the country had minimal Australian bowling presence. Chennai didn't have any, Ashley Noffke and White did little for Bangalore, while Symonds was a disaster with the ball for Hyderabad.
| Team | Total wickets | Average | Econ rate | Aus wickets | Average | Econ rate |
| Rajasthan Royals | 96 | 24.57 | 7.74 | 36 | 21.86 | 7.41 |
| Delhi Daredevils | 82 | 26.51 | 8.15 | 13 | 34.46 | 7.22 |
| Kings XI Punjab | 83 | 28.49 | 8.35 | 11 | 35.27 | 8.81 |
| Mumbai Indians | 83 | 24.66 | 7.86 | 3 | 13.33 | 5.71 |
| Kolkata Knight Riders | 61 | 27.16 | 7.76 | 2 | 65.00 | 10.00 |
| Bangalore Royal Challengers | 56 | 38.23 | 8.18 | 1 | 64.00 | 12.80 |
| Deccan Chargers | 60 | 37.40 | 8.48 | 0 | - | 14.78 |
| Chennai Super Kings | 83 | 30.10 | 8.19 | 0 | - | - |
Most of the Australian frontline batsmen were huge assets, scoring more runs, and at a quicker rate, than the team average. Apart from the obvious stars of the tournament, Marsh and Watson, the others did well too, with Gilchrist top-scoring for his team, and Hayden, Symonds, Katich and Hussey being among the runs as well. The one disappointment was Ponting, who scored only 39 runs in three innings, at a rate well under a run a ball.
| Batsman | Runs | Average | Runs per over | Team average | Team RPO |
| Shaun Marsh | 616 | 68.44 | 8.38 | 31.62 | 8.33 |
| Shane Watson | 472 | 52.44 | 9.10 | 30.30 | 8.07 |
| Adam Gilchrist | 436 | 33.53 | 8.22 | 23.52 | 7.80 |
| David Hussey | 319 | 29.00 | 7.38 | 21.44 | 7.19 |
| James Hopes | 221 | 20.09 | 8.95 | 31.62 | 8.33 |
| Matthew Hayden | 189 | 63.00 | 8.65 | 31.10 | 7.87 |
| Michael Hussey | 168 | 84.00 | 10.08 | 31.10 | 7.87 |
| Andrew Symonds | 161 | 80.50 | 9.20 | 23.52 | 7.80 |
| Luke Pommersbach | 152 | 152.00 | 9.21 | 31.62 | 8.33 |
| Cameron White | 114 | 22.80 | 6.70 | 19.03 | 6.97 |
| Simon Katich | 96 | 96.00 | 8.34 | 31.62 | 8.33 |
| Shane Warne | 70 | 14.00 | 7.11 | 30.30 | 8.07 |
| Dominic Thornely | 39 | 19.50 | 4.41 | 25.98 | 7.54 |
| Ricky Ponting | 39 | 13.00 | 4.41 | 21.44 | 7.19 |
Watson and Warne took the bowling honours,but McGrath wasn't far behind: though his average of 29.75 was higher than the team average, his economy-rate was the second-best in the entire tournament, among bowlers who sent down at least 50 overs.
Move down the table, though, and the numbers aren't as impressive, with Symonds the bowler undoing much of the good work done by Symonds the batsman.
| Bowler | Wickets | Average | Runs per over | Team average | Team RPO |
| Shane Warne | 19 | 21.26 | 7.76 | 24.57 | 7.74 |
| Shane Watson | 17 | 22.52 | 7.07 | 24.57 | 7.74 |
| Glenn McGrath | 12 | 29.75 | 6.61 | 26.51 | 8.15 |
| James Hopes | 7 | 39.42 | 9.85 | 28.49 | 8.35 |
| Brett Lee | 4 | 28.00 | 7.00 | 28.49 | 8.35 |
| Dominic Thornely | 3 | 13.33 | 5.71 | 24.66 | 7.86 |
| David Hussey | 2 | 65.00 | 10.00 | 27.16 | 7.76 |
| Brett Geeves | 1 | 91.00 | 11.37 | 26.51 | 8.15 |
| Andrew Symonds | 0 | - | 14.78 | 37.40 | 8.48 |
S Rajesh is stats editor of Cricinfo