Fairy-tale year for the lower-middle order
The sixth-wicket partnership has been the most prolific of all in Tests in 2016, while batsmen at Nos. 6 and 7 are scoring runs like never before
S Rajesh
Aug 19, 2016, 4:07 AM
The sixth-wicket stands have rescued teams several times in Tests in 2016 • ESPNcricinfo Ltd
In the first innings of the first Test match of 2016 - between South Africa and England in Cape Town - Ben Stokes and Jonny Bairstow put together a scarcely believable 399 runs in 346 balls for the sixth wicket, lifting England from an iffy 223 for 5 to a commanding 622 for 6. That was the highest partnership for the sixth wicket in Test history, going past the undefeated 345-run stand between Kane Williamson and BJ Watling in the new-year Test of 2015, while the run rate of 6.91 is the highest for any 200-plus stand in Tests. Clearly, sixth-wicket pairs took inspiration from that incredible start to the year, for they have been on a tear in Tests this year.
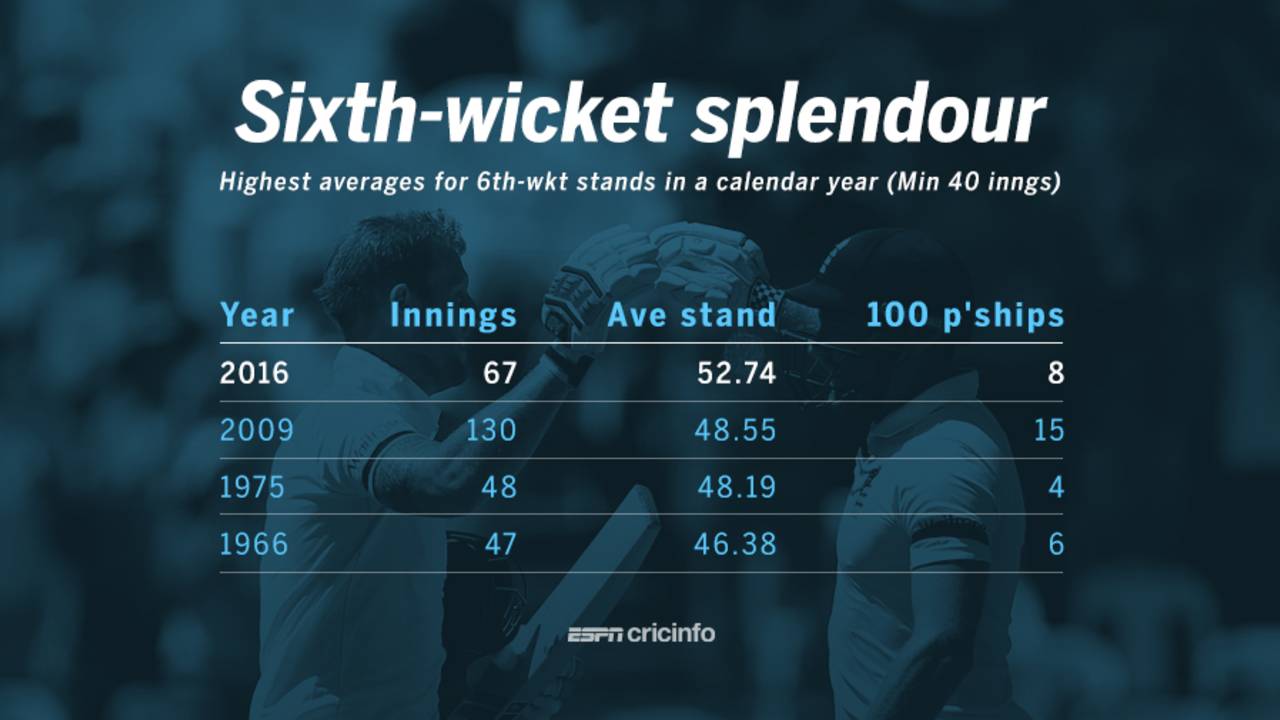
In 67 stands in 2016, sixth-wicket pairs have put together 3481 runs at an average of 52.74. It is the highest average stand for this wicket in any calendar year, with a cut-off of four partnerships in a year. The only year when the sixth-wicket average was higher was in 1897 - 57.33, but in only three innings. There have been eight century stands for the sixth wicket this year, of which four have been in excess of 200; the only other year with four 200-plus partnerships for this wicket was in 2009. The average that year was 48.55, which is the second best in any calendar year.
| Year | P'ships | Runs | Ave stand | 100/ 50 p'ships |
| 2016 | 67 | 3481 | 52.74 | 8/ 15 |
| 2009 | 130 | 6167 | 48.55 | 15/ 29 |
| 1975 | 48 | 2265 | 48.19 | 4/ 17 |
| 1966 | 47 | 2041 | 46.38 | 6/ 7 |
| 1984 | 107 | 4472 | 43.84 | 15/ 14 |
| 2010 | 133 | 5584 | 43.62 | 13/ 25 |
| 1987 | 72 | 2826 | 43.47 | 7/ 13 |
| 2007 | 99 | 3838 | 41.71 | 8/ 21 |
In 2016, the sixth-wicket pairs have put together more runs than any other wicket; the next best is 3296, for the second wicket. In terms of averages, the sixth wicket is 15% better than the second-wicket average of 45.77. Of the top six partnerships for the year, four have been for the sixth wicket.
Among the teams, five have averages of more than 49 for the sixth wickets in Tests this year - India, England, New Zealand, Zimbabwe and Sri Lanka. India average 103.50 in four innings, while England's sixth-wicket pairs have added 1278 runs in 16 innings, easily their highest aggregate for any wicket this year - none of the other wickets have even managed 800.
| Wkt | Inns | Runs | Ave stand | 100/ 50 p'ships |
| 6 | 67 | 3481 | 52.74 | 8/ 15 |
| 2 | 75 | 3296 | 45.77 | 9/ 13 |
| 5 | 68 | 2783 | 41.53 | 9/ 9 |
| 3 | 72 | 2576 | 36.80 | 6/ 12 |
| 7 | 65 | 2142 | 35.11 | 6/ 9 |
| 4 | 70 | 2322 | 34.14 | 3/ 13 |
| 1 | 76 | 2276 | 30.34 | 4/ 10 |
| 8 | 61 | 1248 | 21.51 | 1/ 6 |
| 9 | 56 | 1069 | 19.43 | 0/ 9 |
| 10 | 53 | 768 | 14.76 | 0/ 1 |
Several times this year, the sixth-wicket partnerships have bailed teams out and changed the momentum of the game with meaty contributions after the failures of the more recognised batsmen. Apart from the 399-run stand between Bairstow and Stokes, there was the 213-run partnership between R Ashwin and Wriddhiman Saha against West Indies in the third Test that lifted them from 126 for 5 to a healthy total; in the previous Test in Kingston, Roston Chase and Shane Dowrich had added a match-saving 144 runs as what looked like a certain Indian win became a drawn Test. Meanwhile, in Sri Lanka, their sixth-wicket pair of Dinesh Chandimal and Dhananjaya de Silva led an even more stunning recovery against Australia in the third Test in Colombo, from 26 for 5 to 237 for 6, a stand of 211. Even Zimbabwe had one huge sixth-wicket stand to savour in the second Test against New Zealand in Bulawayo, with Craig Ervine and Peter Moor adding 148.
Most of those partnerships have come in the last three weeks, a period when eight Tests have been played across four series, in the West Indies, England, Sri Lanka and Zimbabwe. During this period, the sixth-wicket pairs have averaged more than 68, while none of the other wickets have managed 50.
| Wkt | Inns | Runs | Ave stand | 100/ 50 p'ships |
| 6 | 27 | 1849 | 68.48 | 6/ 6 |
| 2 | 29 | 1425 | 49.13 | 5/ 3 |
| 5 | 28 | 933 | 34.55 | 1/ 4 |
| 4 | 28 | 947 | 33.82 | 1/ 6 |
| 1 | 30 | 976 | 33.65 | 2/ 5 |
| 3 | 29 | 895 | 31.96 | 2/ 5 |
| 7 | 26 | 703 | 29.29 | 2/ 3 |
| 9 | 23 | 415 | 18.86 | 0/ 3 |
| 8 | 24 | 408 | 17.73 | 0/ 2 |
| 10 | 20 | 269 | 13.45 | 0/ 1 |
The sixth-wicket numbers are particularly interesting as some of the other top-order pairs haven't done so well this year. The average for the first wicket is 30.34, which is the lowest in more than 50 years: the last time it was lower was in 1963 (average 24.26); the average for the fourth wicket is 34.14. These averages tend to suggest conditions that have been pretty good for bowling this year; surprisingly, the batsmen in the lower middle-order have managed to thrive in these conditions. (The seventh-wicket stands have exceeded expectations too, averaging 35.11, second-highest in any calendar year which has had at least 40 partnerships.)
The two pairs who have scored the scored the most sixth-wicket runs this year are both from England, and both have Bairstow as a common factor. With Moeen Ali, he has added 467 runs in seven innings, while with Stokes the aggregate is 424 in three, thanks to that monster stand of 399.
With Bairstow being the key figure in both partnerships, it is hardly surprising that his aggregate at Nos. 6 and 7 is well clear of anyone else at that position. The significant stat is also the fact that the top nine run-scorers at this position all have averages of more than 50. Bairstow's aggregate of 902 is the second highest by any batsman at Nos. 6 and 7 in Tests in any calendar year. Only VVS Laxman, with 984 in 2002, has more runs in a year. Michael Hussey, Garry Sobers and AB de Villiers round off this top five, which makes Bairstow a member of a pretty elite list.
| Player | Inns | Runs | Ave | 100s/ 50s |
| Jonny Bairstow | 14 | 902 | 82.00 | 3/ 3 |
| Moeen Ali | 8 | 494 | 82.33 | 2/ 2 |
| Ben Stokes | 7 | 431 | 61.57 | 1/ 1 |
| Dinesh Chandimal | 7 | 380 | 54.28 | 2/ 0 |
| BJ Watling | 6 | 321 | 64.20 | 1/ 2 |
| Dhananjaya de Silva | 5 | 260 | 52.00 | 1/ 0 |
| Temba Bavuma | 5 | 238 | 79.33 | 1/ 1 |
| R Ashwin | 3 | 234 | 78.00 | 2/ 0 |
| Wriddhiman Saha | 4 | 205 | 51.25 | 1/ 0 |
Thanks to the exploits of Bairstow, Moeen, Stokes, Chandimal, and a few others, the overall average for the Nos. 6 and 7 batsmen this year is the highest among all years when they have played at least 50 innings. So while some of the top-order batsmen have struggled for runs, the lower middle order have never had it as good as they have in 2016.
| Year | Inns | Runs | Average | 100s/ 50s |
| 2016 | 135 | 5350 | 43.85 | 16/ 17 |
| 2009 | 267 | 9651 | 41.06 | 22/ 52 |
| 1966 | 98 | 3520 | 40.45 | 6/ 21 |
| 1989 | 122 | 3794 | 37.94 | 8/ 15 |
| 1984 | 211 | 7135 | 37.55 | 15/ 37 |
| 1975 | 98 | 3223 | 36.62 | 6/ 23 |
| 1991 | 127 | 3807 | 36.25 | 4/ 21 |
| 1949 | 67 | 2008 | 35.22 | 2/ 6 |
S Rajesh is stats editor of ESPNcricinfo. Follow him on Twitter