The chasing formula in IPL 2016
Teams batting second have had it all their way so far in IPL 2016, and openers have racked up some incredible numbers in chases
S Rajesh
Apr 22, 2016, 2:51 AM
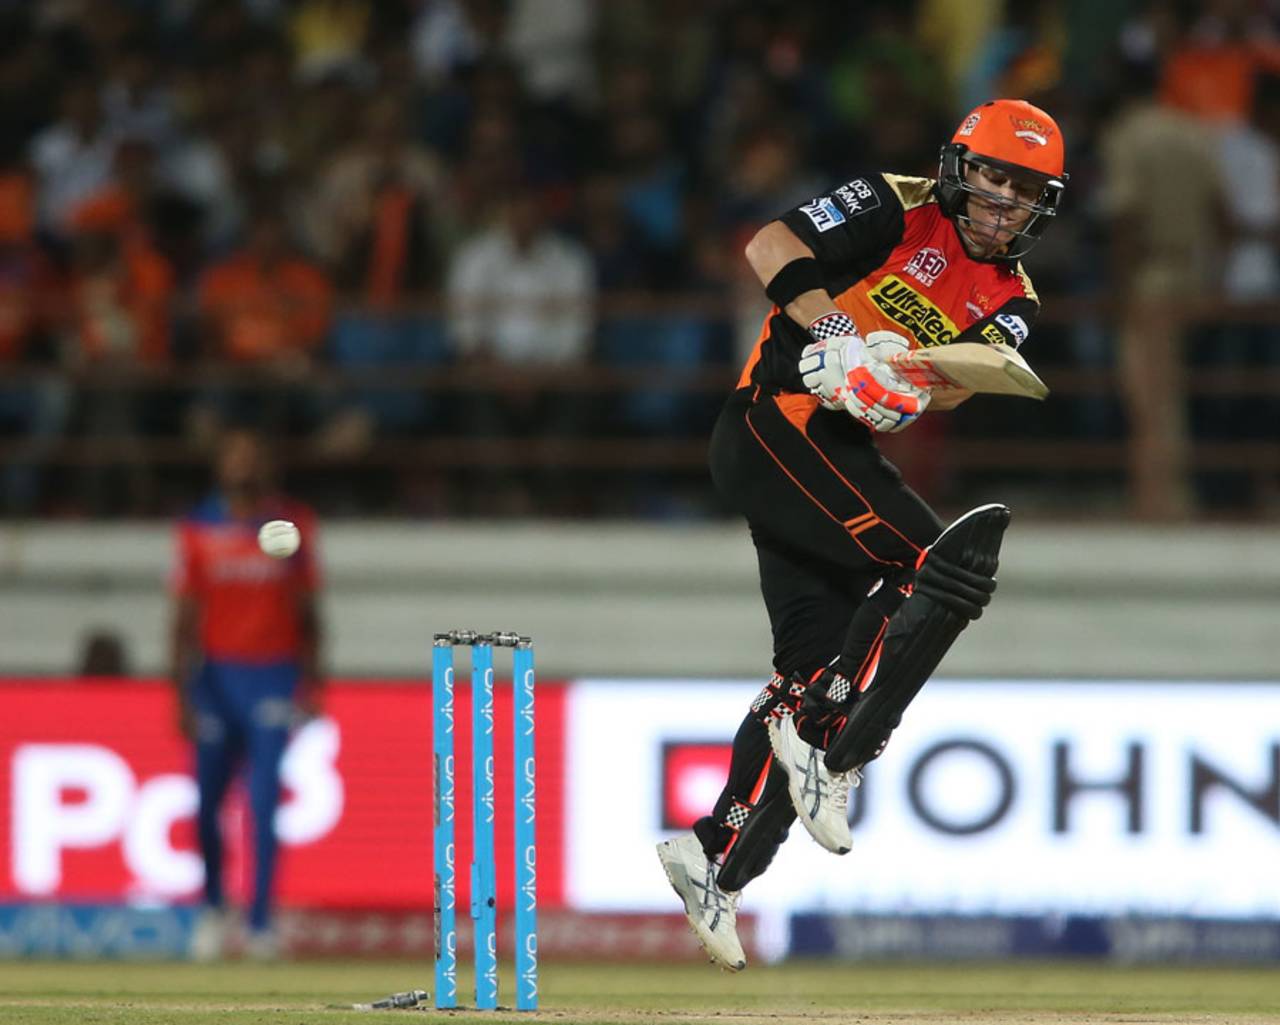
David Warner has been outstanding in this IPL, with three 50-plus scores in three run-chases, and an average of 222 • BCCI
Almost two weeks into the tournament, IPL 2016 hasn't exactly set the cricket world on fire. There have been a few individual streaks of brilliance with bat and ball, but far too often the result has been obvious well before the last ball of the match. The skew in terms of results is almost unbelievable so far - the team chasing has won 14 out of 15 matches. The only exception has been the first match played in Bangalore, when Royal Challengers Bangalore scored 227 after batting first and beat Sunrisers Hyderabad by 45 runs.
In no other edition has the team batting second held such an emphatic advantage: in 2015 they lost more than they won, with a 24-32 record in the entire tournament, though after 15 games last year they had a 10-5 advantage. The year 2014 was the best among all years before this one for teams batting second, but even there the win-loss was only 37-22. This year, teams batting second have already won more than half the games they won in the entire 2015 season. Overall, before the start of the 2016 edition, teams chasing had won 272 games and lost 236 in the IPL. The difference of 36 was built over 518 matches; this year, there is a difference of 13 after just 15 games.
In 2016, the teams chasing a target have averaged 46.24 runs per wicket - more than twice the average of the team batting first - and 8.68 runs per over, which is a run more than the teams batting first. The captains have slowly latched on to the idea of chasing being the much better option: in the last five games from April 17 to 21, the captain winning the toss has chosen to bat second, and has won every time. So far in 2016, teams winning the toss have won ten and lost five; the gap will surely increase if more games go the same way.
| Bat 1st/ chase | Win/loss | Bat ave | Run rate | 50+ |
| Batting first | 1/ 14 | 22.14 | 7.66 | 12 |
| Chasing | 14/ 1 | 46.24 | 8.68 | 17 |
| Year | Mat | Won | Lost | W/ L | Ave | RPO |
| 2016 | 15 | 14 | 1 | 14.00 | 46.24 | 8.68 |
| 2015 | 59 | 24 | 32 | 0.75 | 24.70 | 8.18 |
| 2014 | 60 | 37 | 22 | 1.68 | 28.60 | 8.17 |
| 2013 | 76 | 37 | 37 | 1.00 | 23.14 | 7.47 |
| 2012 | 75 | 40 | 34 | 1.18 | 25.28 | 7.71 |
| 2011 | 73 | 40 | 32 | 1.25 | 26.05 | 7.66 |
| 2009 | 57 | 30 | 26 | 1.15 | 23.57 | 7.37 |
| 2009 | 60 | 28 | 31 | 0.90 | 25.43 | 7.99 |
| 2008 | 58 | 36 | 22 | 1.64 | 29.05 | 8.39 |
The first six overs has been the big difference between the teams batting first and the teams chasing in this tournament so far. Teams batting first have lost 24 wickets in the Powerplay overs, compared with just ten by the team chasing. The trend with the first two games of the tournament, as Mumbai Indians slumped to 37 for 4 against Rising Pune Supergiants, and Delhi Daredevils fared even worse with a Powerplay score of 35 for 4 against Kolkata Knight Riders the next day.
Since those two debacles they have done better and have lost more than one wicket in the Powerplays only three times in the remaining 13 games, but only once have they gone wicketless, when Kings XI Punjab scored 52 without loss against Gujarat Lions in the third game of the tournament. That didn't help them much either, as they ended up losing by five wickets.
On the other hand, teams chasing have never lost more than two wickets in the Powerplay overs, and haven't lost any wickets seven times in 15 matches. Knight Riders, led by Gautam Gambhir and Robin Uthappa at the top of the order, have achieved this three times, while Gujarat Lions, Supergiants, Kings XI, and Sunrisers Hyderabad have done it once each.
Teams batting first haven't finished that well either, though some of that is also because of the wickets lost in the earlier overs.
| 0.1 to 6.0 | 6.1 to 15.0 | 15.1 to 20.0 | ||||
| Bat 1st/2nd | Ave | RR | Ave | RR | Ave | RR |
| Batting first | 27.75 | 7.40 | 26.58 | 7.08 | 15.30 | 9.05 |
| Batting second | 75.10 | 8.34 | 38.92 | 8.24 | 38.63 | 10.99 |
With the Powerplay numbers being so different, it is no surprise that the stats for openers is also hugely different when batting and chasing. In first innings, openers have so far averaged 24, at a strike rate of 124. The average is the lowest among all the IPL tournaments which have been held in Asia: the only season when they averaged lower was in 2009 when South Africa hosted the tournament - the average then was 22.90. Last year in first innings openers averaged 32.64, at a strike rate of 133.
The openers' exceptional overall numbers in this tournament is largely because of their stats in chases, when they have often batted through and remained unbeaten at the end. In fact, there have already been nine not-outs for openers in chases in 15 matches this season; the most not-outs in any season is 15, in the inaugural edition in 2008, while the next highest is 13. This season, Gambhir and Warner already have two not-outs each in chases, while Quinton de Kock, Rohit Sharma, Ajinkya Rahane, Aaron Finch and Shikhar Dhawan have one each. Openers already have 16 fifty-plus scores in chases, and only five when batting first.
The average opening partnership in first innings this season is 17.46, with only one 50-plus stand; in chases, the average is 55.07, with eight 50-plus partnerships.
| Bat 1st/2nd | Inngs | Runs | Average | SR | 50+ |
| Batting first | 30 | 727 | 24.23 | 124.48 | 5 |
| Batting second | 30 | 1367 | 65.09 | 140.49 | 16 |
The chasing team winning almost every time has created a sameness to the IPL this season, and to make matters worse most of those successful run-chases have been one-sided. Of the 14 successful chases, ten times teams have won with ten or more balls to spare, and only three times have games gone into the last over, with one last-ball finish. The average balls remaining in these 14 wins by chasing teams has been 17, which is hardly the definition of close contests. In last year's IPL, the average balls remaining in wins by chasing teams was 12; in 2014 it was 10.
Two weeks into IPL 2016, the tournament is still searching for on-field contests to spice it up.
S Rajesh is stats editor of ESPNcricinfo. Follow him on Twitter