Undaunted by ducks
Batsmen with best and worst averages in innings immediately after being dismissed for a duck
Travis Basevi and George Binoy
15-Apr-2009
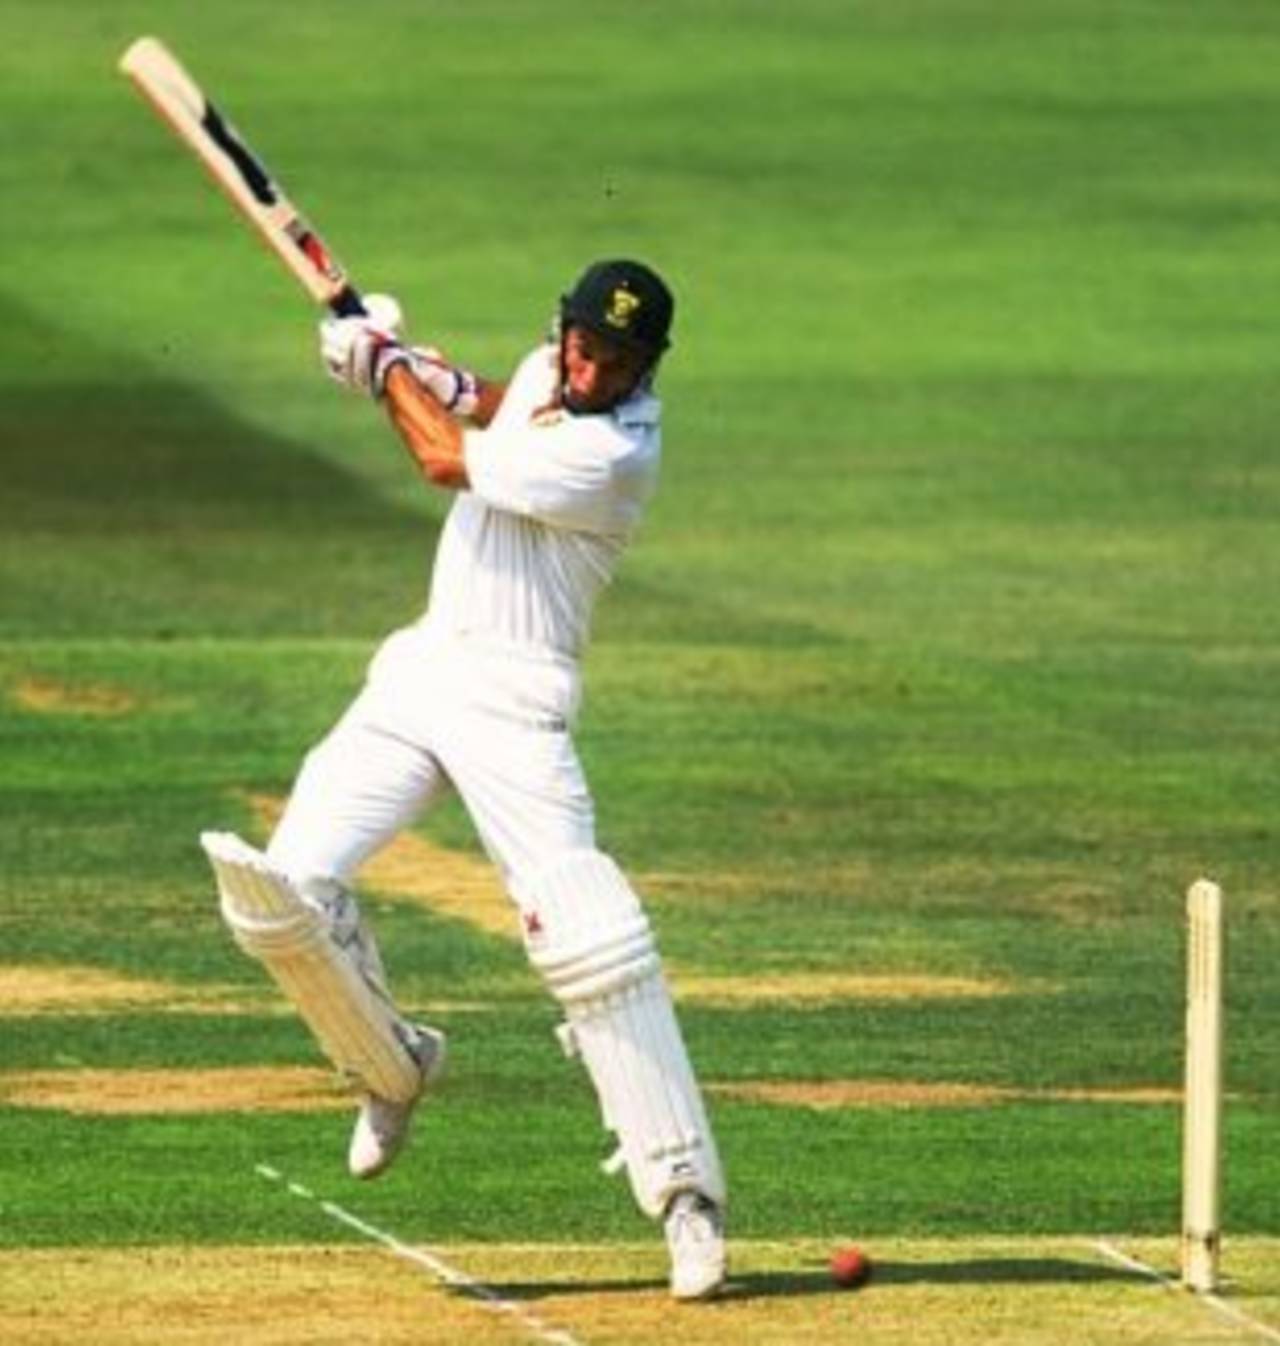
Kepler Wessels never made a duck in ODIs, and averaged 90.75 in the innings after the ones in which he made a duck in Tests • Getty Images
Following last week's column, which featured batsmen with the best and worst averages in innings immediately after scoring a century, we had another request: for a list of players with the highest and lowest averages in innings immediately following a duck. Don Bradman had one of the best averages in innings right after a hundred, and surprise, surprise, his average in innings immediately after a duck is by far the highest.
Bradman made seven ducks in his 80 Test innings and he bounced back hard from each of them. His first zero was against West Indies at the SCG in February 1931. That failure was a distant memory when he scored 226 in his next innings, against South Africa at the Gabba nine months later. Bradman's second duck was a first-baller, bowled by Bill Bowes in the first innings at the MCG during the Bodyline series. He scored a match-winning 103 not out in the second. He was out for no score in consecutive innings against England in Brisbane and Sydney in 1936 before he made 82. Bradman's other scores after ducks were 56 not out and 38, giving him a total of 505 runs at an average of 126.25.
Kepler Wessels abhorred being dismissed for a duck. He was never dismissed for zero in 109 ODIs (105 innings), which is a record, and when he was out for no score in Tests, he came back strongly most times. Wessels followed his five ducks in Tests with scores of 0, 61, 173, 95 not out and 34, giving him an average of 90.75.
Adam Gilchrist and Virender Sehwag had poor averages in ODI innings soon after scoring a century but both have high Test averages in innings immediately after a duck. Gilchrist averages over 85, with four hundreds and five half-centuries, in 14 innings after scoring zeroes. Sehwag averages nearly 58 in 10 innings after ducks. His scores include 155 against Australia in Chennai in 2004, and 254 against Pakistan in Lahore 2006.
| Player | Span | Inns | NO | Runs | HS | Ave | 100 | 50 | 0 | Career | Diff | |
|---|---|---|---|---|---|---|---|---|---|---|---|---|
| DG Bradman (Aus) | 1928-1948 | 6 | 2 | 505 | 226 | 126.25 | 2 | 2 | 1 | 99.94 | 26.30 | |
| Younis Khan (Pak) | 2000-2009 | 11 | 0 | 1084 | 313 | 98.54 | 5 | 1 | 0 | 51.80 | 46.73 | |
| KC Wessels (Aus/SA) | 1982-1994 | 5 | 1 | 363 | 173 | 90.75 | 1 | 2 | 1 | 41.00 | 49.75 | |
| Saeed Anwar (Pak) | 1990-2001 | 8 | 1 | 635 | 188* | 90.71 | 2 | 3 | 1 | 45.52 | 45.18 | |
| AC Gilchrist (Aus) | 1999-2008 | 14 | 3 | 940 | 144 | 85.45 | 4 | 5 | 2 | 47.60 | 37.84 | |
| RB McCosker (Aus) | 1975-1980 | 5 | 1 | 340 | 105 | 85.00 | 1 | 3 | 0 | 39.56 | 45.43 | |
| Yuvraj Singh (India) | 2003-2009 | 6 | 3 | 251 | 77* | 83.66 | 0 | 3 | 0 | 35.56 | 48.10 | |
| R Dravid (ICC/India) | 1996-2009 | 8 | 0 | 632 | 270 | 79.00 | 2 | 2 | 0 | 52.53 | 26.46 | |
| TW Graveney (Eng) | 1951-1969 | 8 | 1 | 513 | 258 | 73.28 | 2 | 1 | 0 | 44.38 | 28.90 | |
| JH Kallis (ICC/SA) | 1995-2009 | 10 | 1 | 638 | 160 | 70.88 | 3 | 3 | 0 | 54.66 | 16.22 | |
| MP Vaughan (Eng) | 1999-2008 | 9 | 1 | 565 | 183 | 70.62 | 3 | 0 | 0 | 41.44 | 29.18 | |
| IR Redpath (Aus) | 1964-1976 | 9 | 2 | 486 | 132 | 69.42 | 2 | 1 | 0 | 43.45 | 25.96 | |
| IR Bell (Eng) | 2004-2009 | 7 | 0 | 484 | 199 | 69.14 | 1 | 4 | 1 | 40.59 | 28.54 | |
| SR Waugh (Aus) | 1985-2004 | 22 | 5 | 1162 | 160 | 68.35 | 4 | 7 | 1 | 51.06 | 17.29 | |
| KG Viljoen (SA) | 1930-1949 | 5 | 0 | 330 | 111 | 66.00 | 1 | 3 | 0 | 28.43 | 37.56 | |
| AJ Strauss (Eng) | 2004-2009 | 9 | 1 | 492 | 177 | 61.50 | 1 | 3 | 0 | 44.26 | 17.23 | |
| Mohammad Yousuf (Pak) | 1998-2007 | 8 | 0 | 490 | 159 | 61.25 | 2 | 2 | 0 | 55.49 | 5.75 | |
| GR Viswanath (India) | 1969-1983 | 10 | 1 | 550 | 222 | 61.11 | 2 | 1 | 0 | 41.93 | 19.18 | |
| IVA Richards (WI) | 1974-1991 | 10 | 1 | 529 | 182* | 58.77 | 2 | 1 | 0 | 50.23 | 8.54 | |
| DB Vengsarkar (India) | 1976-1992 | 15 | 3 | 698 | 109 | 58.16 | 2 | 4 | 1 | 42.13 | 16.03 | |
| V Sehwag (ICC/India) | 2001-2009 | 10 | 0 | 579 | 254 | 57.90 | 2 | 0 | 0 | 50.06 | 7.83 |
It didn't make sense to simply look at the lowest averages in innings immediately after a duck - Mohammad Asif has 0.25, Chris Martin has 0.85 - so we looked at the largest differences between a batsman's average in innings immediately after a duck and his career average.
Hanif Mohammad was not the sort of batsman who'd bounce back immediately from a duck. He made five in his 55-Test career and scored 19, 5, 5, 3 and 2 in the innings that immediately followed. The difference of -37 between his post-duck average of 6.80 and career average of nearly 44 is the highest in our table.
Brian Lara never scored a century immediately after making a duck. He averages less than 28 in 17 such innings, with an aggregate of 474 and only five half-centuries.
| Player | Span | Inns | NO | Runs | HS | Ave | 100 | 50 | 0 | Career | Diff | |
|---|---|---|---|---|---|---|---|---|---|---|---|---|
| Hanif Mohammad (Pak) | 1952-1969 | 5 | 0 | 34 | 19 | 6.80 | 0 | 0 | 0 | 43.98 | -37.18 | |
| 20.40 | 0 | 0 | 0 | 56.67 | -36.27 | |||||||
| VT Trumper (Aus) | 1899-1912 | 7 | 1 | 61 | 16 | 10.16 | 0 | 0 | 2 | 39.04 | -28.88 | |
| RN Harvey (Aus) | 1948-1963 | 7 | 0 | 141 | 71 | 20.14 | 0 | 1 | 1 | 48.41 | -28.27 | |
| 8.20 | 0 | 0 | 0 | 36.38 | -28.18 | |||||||
| PJP Burge (Aus) | 1955-1966 | 5 | 0 | 50 | 15 | 10.00 | 0 | 0 | 0 | 38.16 | -28.16 | |
| LEG Ames (Eng) | 1929-1939 | 5 | 1 | 57 | 19 | 14.25 | 0 | 0 | 0 | 40.56 | -26.31 | |
| 6.85 | 0 | 0 | 2 | 32.38 | -25.52 | |||||||
| DPMD Jayawardene (SL) | 1997-2009 | 10 | 0 | 281 | 57 | 28.10 | 0 | 2 | 1 | 53.23 | -25.13 | |
| BC Lara (ICC/WI) | 1990-2006 | 17 | 0 | 474 | 83 | 27.88 | 0 | 5 | 1 | 52.88 | -25.00 | |
| 9.50 | 0 | 0 | 1 | 33.48 | -23.98 | |||||||
| GS Chappell (Aus) | 1970-1984 | 12 | 2 | 299 | 65 | 29.90 | 0 | 3 | 1 | 53.86 | -23.96 | |
| Majid Khan (Pak) | 1964-1983 | 8 | 0 | 129 | 40 | 16.12 | 0 | 0 | 1 | 38.92 | -22.79 | |
| 7.00 | 0 | 0 | 1 | 29.74 | -22.74 | |||||||
| KR Stackpole (Aus) | 1966-1974 | 4 | 0 | 60 | 33 | 15.00 | 0 | 0 | 1 | 37.42 | -22.42 | |
| DL Amiss (Eng) | 1966-1977 | 10 | 0 | 239 | 99 | 23.90 | 0 | 2 | 3 | 46.30 | -22.40 | |
| 12.57 | 0 | 0 | 0 | 34.46 | -21.89 | |||||||
| MC Cowdrey (Eng) | 1954-1975 | 9 | 0 | 200 | 80 | 22.22 | 0 | 1 | 0 | 44.06 | -21.84 | |
| KD Mackay (Aus) | 1956-1963 | 6 | 0 | 70 | 29 | 11.66 | 0 | 0 | 2 | 33.48 | -21.82 | |
| 11.83 | 0 | 0 | 1 | 33.01 | -21.17 |
MS Dhoni began his ODI career with a duck - run out off his first ball - against Bangladesh in December 2004, and made 12 in his next innings. His scores after his next four ducks, however, were 80, 29, 91 not out, and 14 not out, giving him an average of 75 in five innings. Lance Klusener averaged 66.50 in his 13 innings after scoring a duck, largely because he remained not out in seven of them.
| Player | Span | Inns | NO | Runs | HS | Ave | 100 | 50 | 0 | Career | Diff | |
|---|---|---|---|---|---|---|---|---|---|---|---|---|
| DM Jones (Aus) | 1984-1994 | 6 | 2 | 318 | 84 | 79.50 | 0 | 4 | 1 | 44.61 | 34.88 | |
| MS Dhoni (Asia/India) | 2004-2009 | 5 | 2 | 226 | 91* | 75.33 | 0 | 2 | 0 | 49.26 | 26.06 | |
| 66.50 | 1 | 1 | 2 | 41.10 | 25.39 | |||||||
| ALF de Mel (SL) | 1982-1987 | 5 | 4 | 65 | 23* | 65.00 | 0 | 0 | 1 | 14.56 | 50.43 | |
| WJ Cronje (SA) | 1992-2000 | 8 | 3 | 312 | 112 | 62.40 | 1 | 2 | 1 | 38.64 | 23.75 | |
| 61.80 | 1 | 1 | 0 | 37.08 | 24.71 | |||||||
| DR Martyn (Aus) | 1992-2006 | 10 | 4 | 355 | 68* | 59.16 | 0 | 5 | 0 | 40.80 | 18.35 | |
| DB Vengsarkar (India) | 1976-1991 | 7 | 2 | 295 | 54 | 59.00 | 0 | 2 | 0 | 34.73 | 24.26 | |
| 54.09 | 1 | 5 | 0 | 41.37 | 12.71 | |||||||
| GW Flower (Zim) | 1992-2004 | 18 | 3 | 798 | 142* | 53.20 | 2 | 5 | 1 | 33.69 | 19.50 | |
| Imran Nazir (Pak) | 1999-2007 | 10 | 2 | 415 | 105* | 51.87 | 1 | 2 | 0 | 24.77 | 27.09 | |
| 50.71 | 0 | 2 | 0 | 28.44 | 22.26 | |||||||
| Mohammad Yousuf (Asia/Pak) | 1998-2008 | 15 | 1 | 706 | 141* | 50.42 | 2 | 5 | 1 | 43.18 | 7.24 | |
| DL Houghton (Zim) | 1983-1997 | 5 | 0 | 251 | 142 | 50.20 | 1 | 1 | 0 | 26.37 | 23.82 | |
| 49.25 | 0 | 1 | 0 | 25.95 | 23.29 | |||||||
| IA Healy (Aus) | 1988-1997 | 9 | 4 | 237 | 51 | 47.40 | 0 | 2 | 0 | 21.00 | 26.40 | |
| WW Hinds (WI) | 1999-2006 | 8 | 3 | 236 | 54 | 47.20 | 0 | 1 | 0 | 28.92 | 18.27 | |
| 46.06 | 1 | 5 | 0 | 41.02 | 5.04 | |||||||
| MV Boucher (Afr/SA) | 1998-2009 | 16 | 5 | 502 | 76 | 45.63 | 0 | 3 | 0 | 29.11 | 16.52 | |
| A Flower (Zim) | 1992-2003 | 13 | 2 | 485 | 99* | 44.09 | 0 | 5 | 1 | 35.34 | 8.74 |
Sachin Tendulkar has the second largest difference (-22) between his average in innings immediately after a duck and his career average. Tendulkar's been out for a duck 20 times in one-day internationals and his aggregate in innings immediately after is only 424 at an average of 22.31, with one century and two fifties, compared to his career figure of 44.37.
| Player | Span | Inns | NO | Runs | HS | Ave | 100 | 50 | 0 | Career | Diff | |
|---|---|---|---|---|---|---|---|---|---|---|---|---|
| M Kaif (India) | 2002-2006 | 8 | 0 | 74 | 32 | 9.25 | 0 | 0 | 2 | 32.01 | -22.76 | |
| 22.31 | 1 | 2 | 3 | 44.37 | -22.05 | |||||||
| RB Richardson (WI) | 1983-1996 | 8 | 0 | 96 | 50 | 12.00 | 0 | 1 | 1 | 33.41 | -21.41 | |
| CL Hooper (WI) | 1987-2003 | 7 | 2 | 75 | 34 | 15.00 | 0 | 0 | 0 | 35.34 | -20.34 | |
| 21.87 | 0 | 0 | 2 | 41.19 | -19.31 | |||||||
| GS Chappell (Aus) | 1971-1983 | 7 | 1 | 130 | 35 | 21.66 | 0 | 0 | 1 | 40.18 | -18.52 | |
| AJ Lamb (Eng) | 1982-1992 | 8 | 0 | 168 | 52 | 21.00 | 0 | 1 | 0 | 39.31 | -18.31 | |
| 23.50 | 0 | 0 | 0 | 41.54 | -18.04 | |||||||
| IVA Richards (WI) | 1975-1991 | 7 | 0 | 206 | 62 | 29.42 | 0 | 1 | 0 | 47.00 | -17.57 | |
| HH Streak (Afr/Zim) | 1993-2005 | 6 | 1 | 54 | 19* | 10.80 | 0 | 0 | 0 | 28.29 | -17.49 | |
| 13.60 | 0 | 0 | 1 | 30.09 | -16.49 | |||||||
| A Symonds (Aus) | 1998-2008 | 15 | 3 | 287 | 103* | 23.91 | 1 | 0 | 3 | 40.37 | -16.45 | |
| AL Logie (WI) | 1981-1993 | 13 | 2 | 144 | 45* | 13.09 | 0 | 0 | 5 | 28.95 | -15.86 | |
| 16.33 | 0 | 0 | 2 | 32.01 | -15.68 | |||||||
| R Dravid (Asia/ICC/India) | 1996-2007 | 13 | 0 | 312 | 99 | 24.00 | 0 | 2 | 0 | 39.49 | -15.49 | |
| PA Strang (Zim) | 1994-2001 | 5 | 1 | 29 | 16 | 7.25 | 0 | 0 | 1 | 22.24 | -14.99 | |
| 8.33 | 0 | 0 | 2 | 23.28 | -14.95 | |||||||
| CM Spearman (NZ) | 1995-2001 | 6 | 0 | 25 | 11 | 4.16 | 0 | 0 | 1 | 18.72 | -14.55 | |
| Shoaib Mohammad (Pak) | 1984-1993 | 8 | 0 | 80 | 43 | 10.00 | 0 | 0 | 3 | 24.40 | -14.40 | |
| 18.22 | 1 | 1 | 6 | 32.03 | -13.81 |
If there's a particular List that you would like to see, email us with your comments and suggestions.
George Binoy is a senior sub-editor at Cricinfo