India the worst against the tail
Stats highlights from the third day of the second Test between Australia and India in Brisbane
Bishen Jeswant
19-Dec-2014
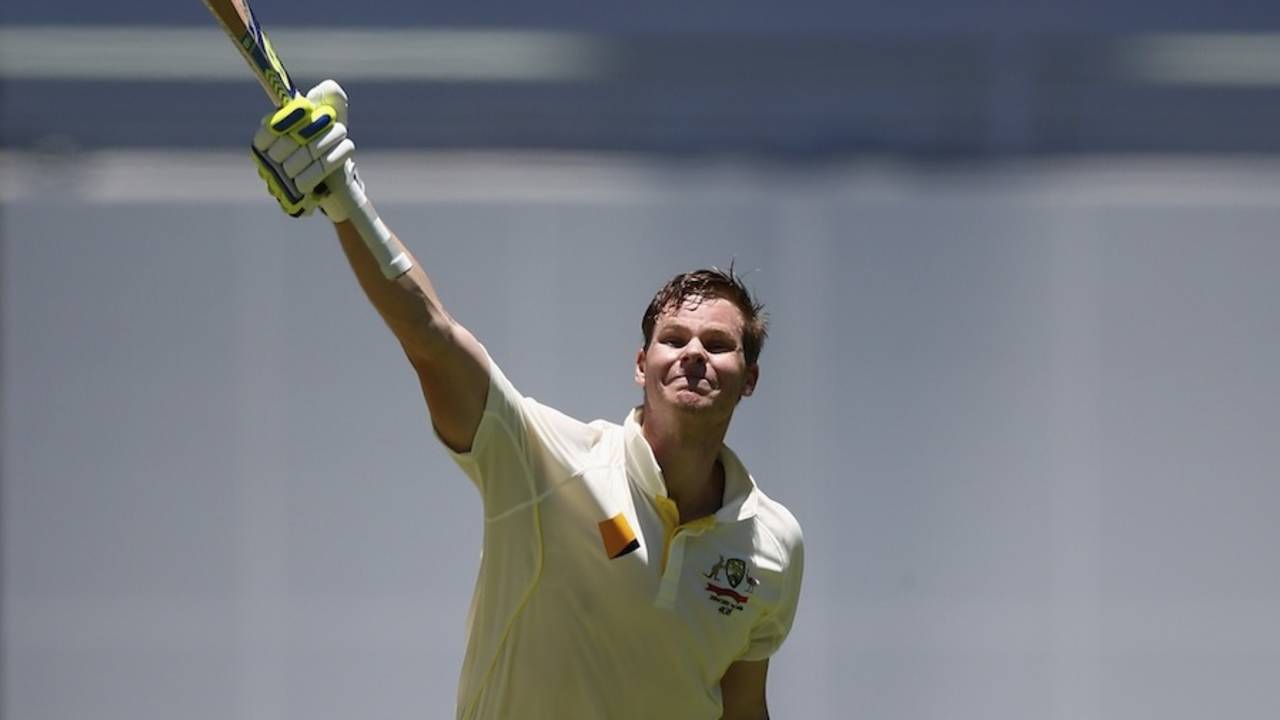
Steven Smith made 133, the fifth highest score by an Australian on captaincy debut • Getty Images
10 Number of Australians with a century on captaincy debut. The last batsman to do this before Steven Smith was Grahan Yallop, in 1978, also in Brisbane.
7 Number of times since 2010 that India have allowed the opposition to make 400-plus in a Test innings after having them five down for 250 or fewer. Four of those innings have been in 2014, twice in England and once in New Zealand, apart from Australia's first innings in the current Test.
44.84 Average runs per tail-end partnership against India in 2014, the highest against any team. Sri Lanka, who are the next worst, only conceded 26.54 runs per tail-end partnership this year.
5 Number of 100-plus tail-end partnerships posted by teams against India in 2014. The only other teams that have allowed tail-end partnerships to put on 100-plus runs more than once are England and Bangladesh, twice each. Five out of the seven highest tail-end partnerships in 2014 are against India.
4.06 Run rate for tail-end partnerships (seventh to tenth wickets) against India away from home since 2010. No other team has conceded four per over against the tail.
| Opposition | Partnerships | Runs | Ave | RR | 100 | 50 |
| India | 145 | 4695 | 34.77 | 4.06 | 12 | 19 |
| West Indies | 75 | 2328 | 31.89 | 3.90 | 4 | 10 |
| Sri Lanka | 81 | 1962 | 25.15 | 3.66 | 1 | 14 |
| South Africa | 121 | 2414 | 20.45 | 3.42 | 1 | 12 |
| New Zealand | 120 | 2516 | 21.32 | 3.41 | 3 | 11 |
| England | 155 | 3337 | 22.39 | 3.33 | 3 | 17 |
| Australia | 161 | 2748 | 17.72 | 3.29 | 2 | 9 |
| Pakistan | 273 | 5838 | 21.78 | 3.18 | 7 | 23 |
1 Number of times an overseas opening pair has posted two 50-plus stands in the same Test in Brisbane. England's Geoff Pullar and David Sheppard did it in 1962. M Vijay and Shikhar Dhawan posted 56 runs in the first innings, and 41 in the second.
17 Johnson's bowling average in Tests when he bowls after making a 50-plus score. He has picked up 36 wickets under these circumstances at an average of 17.30, in six Tests. Johnson scored 88 during Australia's first innings.
8.5 Innings per 50-plus scores for tail-end batsmen (Nos. 8 to 11) against India away from home since 2010. When playing in India, tailenders only make a 50-plus score once every 30 innings against India.
| Home/away | Mat | Inns | Runs | Ave | SR | 100 | 50 | Inns/50 |
| Away | 30 | 145 | 2694 | 24.94 | 62.03 | 1 | 16 | 8.5 |
| Home | 22 | 152 | 1646 | 14.18 | 43.16 | 0 | 5 | 30.4 |
9.1 Brad Haddin's batting average in 12 innings since the last Ashes. He has scored 91 runs in this period, with a highest of 22. He 6 in Australia's first innings in this Test.
68.40 Batting average of Australian captains in Brisbane since 1990, the highest for captains at any home venue in this period (minimum 15 Tests).
Bishen Jeswant is a stats sub editor at ESPNCricinfo. @bishen_jeswant