Warner and Burns fly high
Stats highlights from a day dominated by Australia's openers, and Kane Williamson
S Rajesh
07-Nov-2015
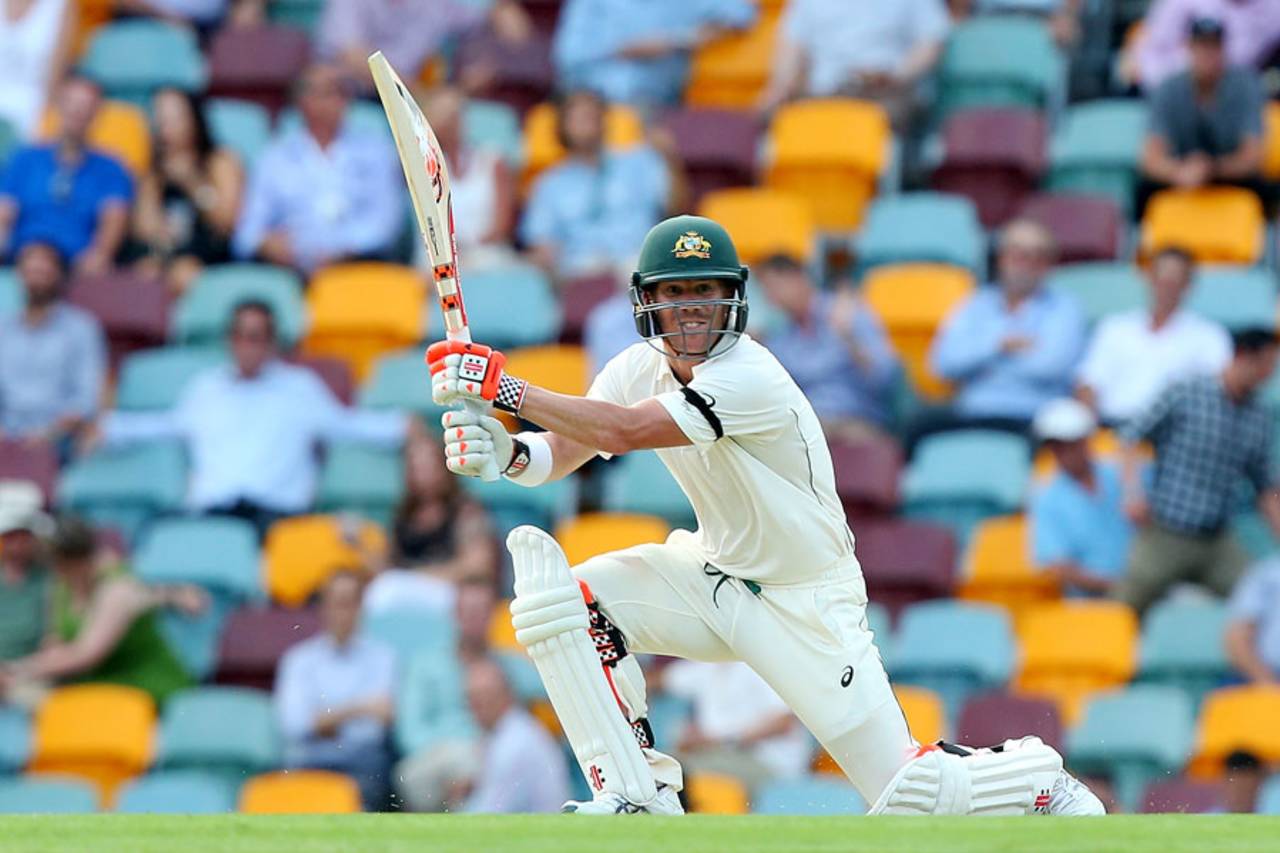
David Warner became only the third batsman to score a century in each innings of a Test three times, after Sunil Gavaskar and Ricky Ponting • Getty Images
4 Number of consecutive century stands for the first wicket for Australia; David Warner and Chris Rogers had put together century partnerships at Trent Bridge and The Oval in Australia's last two innings of the 2015 Ashes series, while Warner and Joe Burns added 161 and 237 in this Test. It's the first time in Test history that any team has managed four successive century partnerships for the first wicket. It's also the first time any team has had two 150-plus opening partnerships in the same Test, and the first time Australia have had two century stands for the first wicket in a Test.
3 Australian opening pairs who have had century stands in each of their first two partnerships in Tests. Warren Bardsley and Herbie Collins, who opened in the 1920s, got 123 and 116 in their first two partnerships, while Matthew Hayden and Justin Langer started with partnerships of 158, 224 and 223 in their first three innings.
2 Instances of the same pair getting two 150-plus stands in a Test. The only previous instance was in 1938, by England's Paul Gibb and Eddie Paynter, who added 184 and 168 against South Africa in Johannesburg.
3 Batsmen who have scored a century in each innings of a Test three times. Before Warner, only Sunil Gavaskar and Ricky Ponting had achieved this. Warner had a scored a century in each innings twice in 2014 - against India in Adelaide, and against South Africa in Cape Town.
398 Runs added by Warner and Burns in this Test, the fourth-best by an opening pair in a Test.
479* Runs scored by Australia's openers in the match, which equals the third-highest by the openers from a team in a Test. The highest in any Test is 550, by Graeme Smith and Herschelle Gibbs against England at Edgbaston in 2003, while Graham Gooch and Michael Atherton added 536 at Lord's against India in 1990. England's Jack Hobbs and Herbert Sutcliffe also scored exactly 479 against Australia in Melbourne in 1925.
4.75 Australia's run rate in this Test, their best against New Zealand, and their seventh-highest against any team.
8 Number of Australian batsmen who have brought up their maiden Test hundred with a six. Before Burns, the others to achieve this were John Benaud, Ian Davis, Greg Mathews, Andrew Symonds, Phil Hughes, Mitchell Johnson, and Steven Smith.
1 Number of New Zealand batsmen who have scored more in a Test innings at the Gabba than Kane Williamson's 140. In New Zealand's famous win here in 1985, Martin Crowe made 188.
8 Number of different opposition teams against whom Williamson has scored at least one Test hundred. The only team missing from the list is Zimbabwe, against whom his highest in three innings is 68. Of his 11 Test hundreds, he has two each against India, Sri Lanka and West Indies, and one each against the others, excluding Zimbabwe.
2077 Runs scored by Williamson in all international matches this year, which puts him on top of the list. Joe Root is next on 1934, followed by Steven Smith on 1923. In 2015, Williamson has scored 616 Test runs at an average of 102.66 (with three hundreds in seven innings), 1317 ODI runs at 57.26 (SR 90.32), and 144 T20I runs at 36 (SR 165.51).
73.57 Williamson's Test average since the beginning of 2014. Among batsmen with at least 1000 runs during this period only Smith has a higher average (74.96), while Root is next with an average of 71.20.
38.07 New Zealand's average partnership for each of the last five wickets, in Tests since the beginning of 2014. It's easily the highest among all teams, and almost 35% better than the next-best, England's 28.25. For each of the first five wickets, New Zealand's average stand is 39.48, which is seventh among ten teams.
* Nov 8, 1010GMT: This stat has been corrected to include two instances of more runs being scored by openers from a team in a Test.
With contributions from Bharath Seervi.
S Rajesh is stats editor of ESPNcricinfo. @rajeshstats