Australia's seventh, New Zealand's first
While Australia have been regulars in World Cup finals and have won the title four times, for New Zealand this is their maiden entry
Shiva Jayaraman
28-Mar-2015
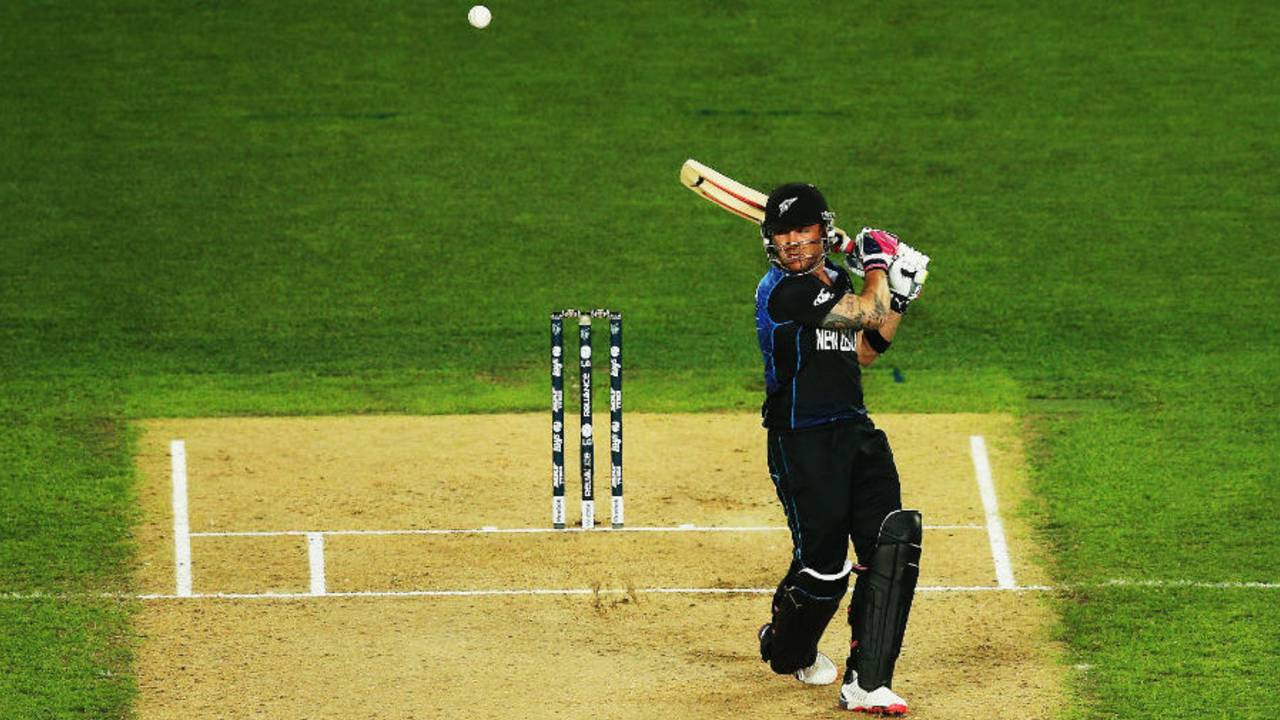
Brendon McCullum has hit 17 sixes within the first 10 overs. He has batted beyond the 10th over only once. • Getty Images
1 Number of World Cup knockouts played between Australia and New Zealand before the final in this World Cup. Australia won the quarter-finals in 1996. New Zealand's win in the league match in Auckland earlier was only their third over Australia in World Cups out of nine matches.
7 Number of times Australia have made it to a World Cup final. No other team has featured in more than three finals; New Zealand will be playing their first.
1981 The last time New Zealand won the final of a multi-team tournament against Australia, which was the first of the three finals of a tri-series. Since then, New Zealand have lost 12 finals to Australia, the last of which was in the 2009 Champions Trophy.
3-2 New Zealand's win-loss record in the last five ODIs against Australia at the MCG, the last of which was won by New Zealand in 2009. But besides the three wins, New Zealand have won only one other game, way back in 1983. Overall Australia have a 14-4 record against New Zealand at this venue for a win-loss ratio of 3.5, which is their best against any team they have played more than two times at the venue. Australia's record against New Zealand in the finals of any tournament at the MCG is 5-0.
6 Number of consecutive ODI wins for Australia at the MCG. The last time they lost here was against Sri Lanka in 2012. Australia have won 8 of their last 10 games here.
4 Wickets taken by Tim Southee in five games since his 7 for 33 against England. Southee has conceded 294 runs from 46 overs since then at an economy of 6.43. Southee averages 85.50 against the batsmen in the current Australia squad.
| Wkts | BBI | Ave | Econ | |
| First-3 matches | 11 | 7/33 | 10.09 | 4.11 |
| Last-5 matches | 4 | 2/65 | 74.00 | 6.43 |
61 Total runs scored by Australia's top-order (No. 1 to No. 3) against New Zealand in ODIs as opposed to their middle-order (No. 4 to No. 7) which has 2216 runs against them. While Michael Clarke has hit 944 runs at 39.33 against New Zealand, Brad Haddin has hit 692 runs against them - the most he has against any team in ODIs. Both of Haddin's ODI hundreds have come against New Zealand. Watson has done well too, scoring 550 runs at an average of 45.83.
| Inns | Runs | Ave | SR | 100s/50s | |
| Top-order | 5 | 61 | 12.20 | 68.53 | 0/0 |
| Middle-order | 61 | 2216 | 42.61 | 85.39 | 3/14 |
208 Runs scored by New Zealand's openers - Brendon McCullum and Martin Guptill - off Mitchell Johnson in ODIs. While McCullum has scored 113 off 102 Johnson deliveries and has been dismissed only once, Guptill has 95 from 132 balls and has been dismissed twice by the bowler.
| Batsman | Conc | Wkts | Balls | Ave | Eco |
| Brendon McCullum | 113 | 1 | 102 | 113.00 | 6.65 |
| Martin Guptill | 95 | 2 | 132 | 47.50 | 4.32 |
65.61 Aaron Finch's batting average at the MCG. He has scored two hundreds and one fifty in six innings at this venue, with 135, 96, 22, and 121 his last four scores. However, Finch's opening partner David Warner hasn't done too well at this venue having scored just 129 runs from his seven innings.
10 Number of fifty-plus scores by Steven Smith in 19 ODI innings since October 2014. He hadn't scored a fifty in his first 38 ODI innings. Since October 2014, Smith has scored 1016 runs at an average of 67.73 including four hundreds and six fifties. Smith's 337 runs in this series are the third-highest by an Australia No. 3 in any World Cup.
| Runs | HS | Ave | SR | 100s/50s | |
| First 38 ODIs | 477 | 46* | 20.73 | 86.56 | 0/0 |
| Last 19 ODIs | 1016 | 105 | 67.73 | 91.44 | 4/6 |
3 Number of times Shane Watson has got out on a duck in his last-five ODIs innings at the MCG. In spite of his three recent ducks, Watson averages 35.66 from 15 innings at what has been his most productive venue in Tests. He has hit six fifty-plus scores from nine Test innings at the MCG, scoring 517 runs at an average of 73.85.
9 Number of innings since the last time Martin Guptill hit a fifty against Australia in ODIs. In nine innings since then Guptill has managed 154 runs against Australia at an average of 17.11 and a highest of 40. Among the bowlers in the current Australia team, Shane Watson has dismissed him thrice in 29 deliveries.
16.17 Ross Taylor's batting average against the bowlers in the current Australia team. Taylor has scored 194 runs against them at a strike rate of 62.78. Taylor has been dismissed five times by Johnson in 132 balls and four times by Watson in 82 deliveries. Overall though, Taylor has hit 764 runs against Australia - his highest against any team in ODIs - at an average of 36.38 including a century and six fifties.
| Bowler | Runs | Dis | Balls | SR |
| Mitchell Johnson | 92 | 5 | 132 | 69.70 |
| Shane Watson | 45 | 4 | 82 | 54.88 |
| Michael Clarke | 52 | 2 | 81 | 64.20 |
| Mitchell Starc | 0 | 1 | 1 | 0.00 |
17 Sixes hit by Brendon McCullum out of the 58 that have been hit in the mandatory Powerplays in this World Cup. He has hit none after the tenth over. McCullum's 17 sixes are the fourth-highest by any batsman in a World Cup. Out of his eight innings in this World Cup, McCullum has batted beyond the 10th over only once, against Sri Lanka in Christchurch. Of the 150 balls he has faced inside the first-ten overs, he has hit 59 boundaries scoring 308 runs at a strike rate of 205.33.
1 Number of century stands conceded by both Australia and New Zealand in this World Cup - the least among teams. Oppositions have averaged 20.77 per wicket against Australia - the least against any team in his World Cup. New Zealand have conceded 22.97 runs per wicket in this World Cup.
25.71 Australia's average opening stand in this series - the second-worst their first wicket has averaged per dismissal in any World Cup. They had averaged 24.83 runs per dismissal in 1983. Australia's openers have put on only one fifty stand in seven innings.
14 Maidens by Boult out of the 75 overs he has bowled in this World Cup - seven more than the highest bowled by any other bowler. Boult has bowled 296 dot-balls, which is also the most by any bowler in this World Cup. However, in terms of dot-ball percentage, Boult's 65.78% is only the third-highest for any bowler who has bowled at least 50 overs in this World Cup. Mitchell Starc leads this list with 228 dot-balls out of 335 deliveries (68.06%). Boult is the leading wicket-taker in this World Cup with 21 victims, while Starc is a close-second with 20 wickets.
Shiva Jayaraman is a sub-editor (stats) at ESPNcricinfo