West Indies' batting cuts advantage of hosts
Although history and form make Sri Lanka the favourites, West Indies' power-packed batting line-up poses a major threat to the hosts' chances
Madhusudhan Ramakrishnan
06-Oct-2012
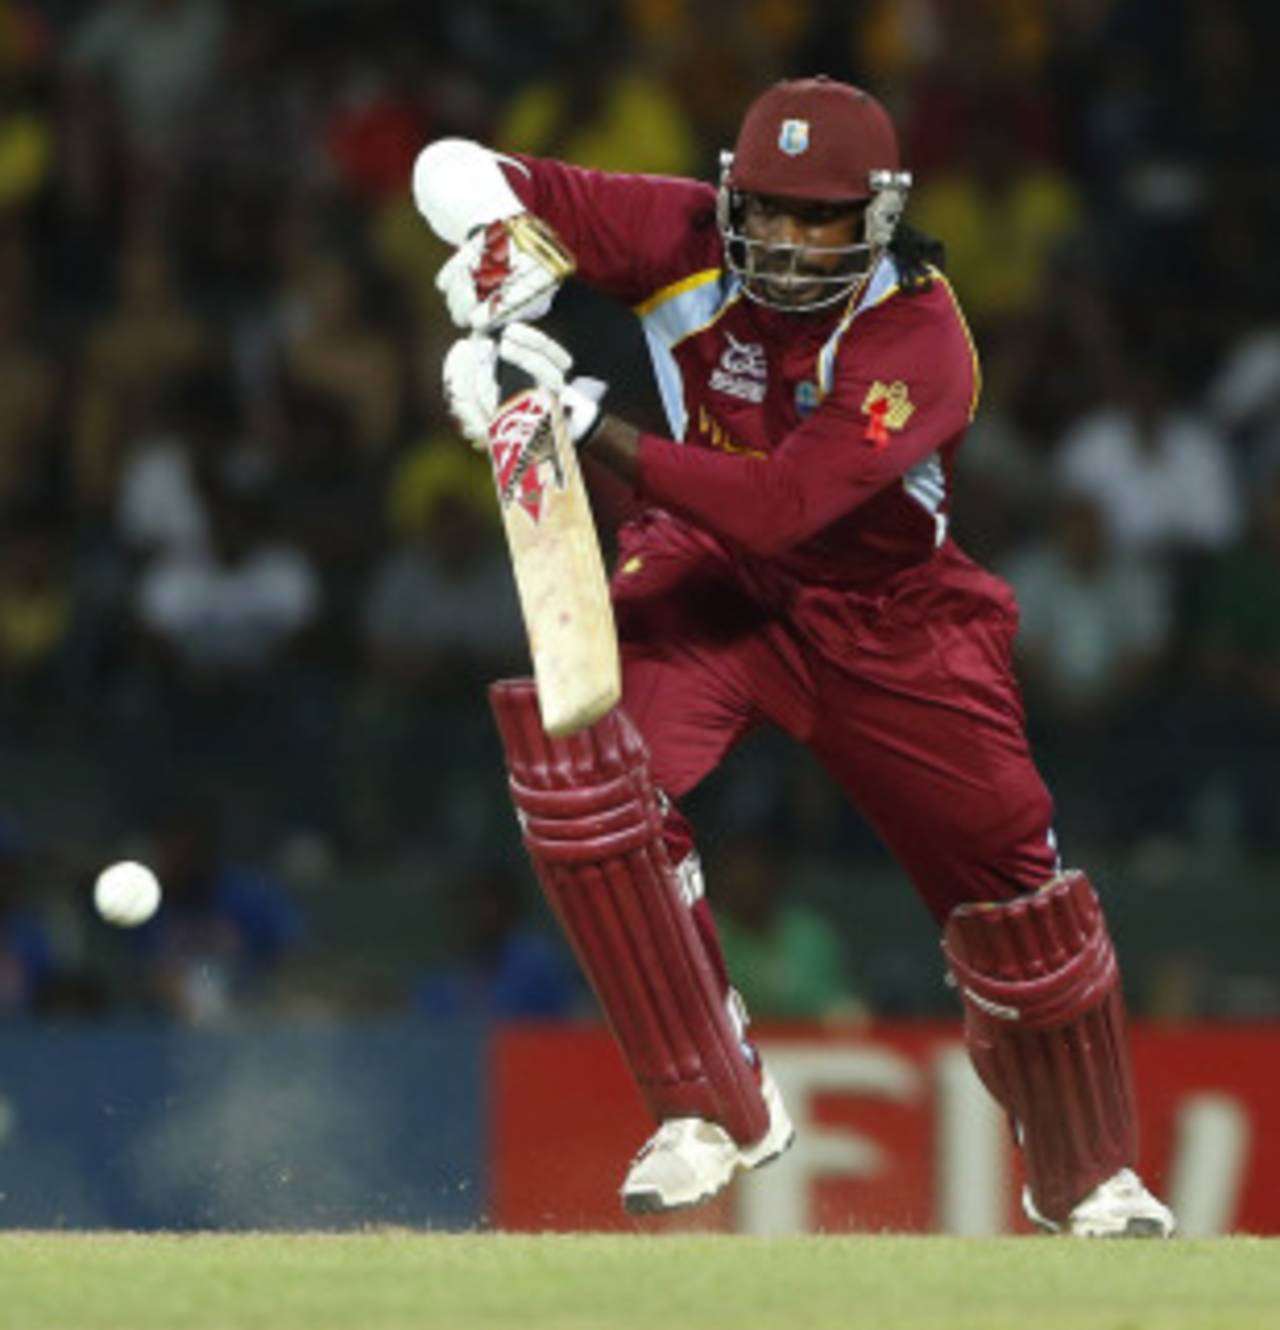
West Indies must avoid an over-dependence on Chris Gayle if they are to upstage Sri Lanka • Associated Press
One need not look beyond the two semi-finals to understand the vagaries of the Twenty20 format. In the first semi-final, Sri Lanka clawed their way to a modest 139 but produced a fantastic bowling performance to defend the total against an in-form Pakistan. The second semi-final followed a completely different script. West Indies, who had provided glimpses of their hitting power earlier in the tournament, took apart a quality Australian bowling attack and registered a massive 205. In response, Australia hardly managed a fight and went down by a huge margin of 74 runs.
Perhaps the only similarity between Sri Lanka and West Indies' performance in the semi-finals was the fact that both teams scored heavily off the last over of the innings to put the game beyond the opposition. Sri Lanka have been superb throughout the tournament, losing only once in a rain-curtailed seven-over game against South Africa. On the other hand, West Indies have waxed and waned, alternating between the sublime and ordinary. The hosts will be confident against a team, whom they have never lost to previously, but will also be aware that the history and reputation matter very little if the powerful West Indies batting-line up clicks.
Sri Lanka started slowly in the format and failed to make much of an impact in the first World Twenty20 in 2007. However, they turned things around very quickly and made the final in the 2009 edition where they lost to Pakistan. Along with Pakistan, they have been the most consistent team in the World Twenty20, reaching two finals and one semi-final in the last three tournaments. Overall, they have an excellent record in the format, winning 29 matches and losing just 18 (w/l ratio of 1.61). In contrast, West Indies have a win-loss ratio lesser than one (20 wins and 23 losses).
In terms of recent form (since January 2010), too, Sri Lanka are well ahead of West Indies. In their four matches against West Indies, Sri Lanka have emerged comfortable winners on all occasions with the most recent one a nine-wicket win in the Super Eights. Sri Lanka, however, have an even win-loss record in the subcontinent and have won just once chasing in home T20 internationals. Given the history of clashes between the two teams and the hosts' poor record in home chases, West Indies stand a much better chance if they bat first.
*Super-Over wins are treated as wins
| Sri Lanka (played) | Sri Lanka (wins/losses) | West Indies (played) | West Indies (wins/losses) | |
| Overall | 47 | 29/18 | 44 | 20/23* |
| Since Jan 2010 | 22 | 14/8 | 26 | 11/14 |
| In subcontinent (including UAE) | 18 | 9/9 | 7 | 3/3 |
In the group stage, West Indies failed to win a single game but managed to qualify for the Super Eights due to a superior net run-rate. Against both Australia (group match) and England (Super Eights), they managed to post excellent totals. However, they collapsed to a below-par total against Sri Lanka and were lucky to get out of jail against a spirited New Zealand side in a Super-Over finish.
Sri Lanka, however, have been the epitome of consistency in the tournament so far. They, too, scraped through against New Zealand in a Super Over but ran out comfortable winners against West Indies and England. West Indies' run-rate is ahead of Sri Lanka's but the hosts have been by far the most economical. The average difference (difference between batting and bowling averages) for Sri Lanka (14.35) is much better than the corresponding figure for West Indies (-1.00). West Indies, the team with the most sixes in the tournament, have comfortably out-hit Sri Lanka on the boundary front but have also conceded more boundary runs. While West Indies have more fifty-plus scores (6) than Sri Lanka (2), the hosts have had a six-wicket haul by Ajantha Mendis (against Zimbabwe) and a five-for by Lasith Malinga (against England).
*Super-Over wins are treated as wins
| Matches | W/L* | Bat rr/bowl rr | Bat avg/bowl avg | 4s/6s scored | 4s/6s conceded | 50+ scores | 4+ wkt | |
| Sri Lanka |
6 | 5/1 | 8.20/7.21 | 32.30/17.95 | 82/17 | 60/21 | 2 | 2 |
| West Indies | 6 | 3/2 | 8.47/7.91 | 26.34/27.34 | 69/42 | 67/25 | 6 | 0 |
With both Mahela Jayawardene and Tillakaratne Dilshan in good form, Sri Lanka's average and run-rate in the first six-over period have been excellent. On the other hand, Gayle's sedate starts and Johnson Charles' inconsistency have brought down the corresponding numbers for West Indies.
In the middle overs (7-14), West Indies have a higher average and scoring-rate primarily because of Gayle's tendency to accelerate a little later in the innings. Sri Lanka have a top-heavy batting line-up and as a result, have found it much tougher to score quickly in the middle overs. In the final six-over period, West Indies have a lower average but a superb scoring-rate (10.30). Aided by a power-packed middle order, West Indies scored 63 runs off the last four overs in the semi-final against Australia.
On the bowling front, Sri Lanka are well ahead of West Indies. In the first six overs, Sri Lanka have both a lower average (21.27) and economy rate (6.50). Sri Lanka's quality spin attack has ensured that the hosts have excellent numbers in the middle overs (7-14). West Indies, on the other hand, have been inconsistent and expensive in the middle-over period. In the final six-over period, Sri Lanka have been outstanding. They were extremely economical in the first semi-final and stifled Pakistan's scoring rate with their variety. In contrast, West Indies have lacked the necessary discipline in the final overs and have conceded over nine runs per over in the final six-over period.
| Sri Lanka (avg, rr (bat)) | West Indies (avg, rr (bat)) | Sri Lanka (avg, rr (bowl)) | West Indies (avg, rr (bowl)) | |
| Overs 1-6 | 48.66/8.11 | 32.28/7.53 | 21.27/6.50 | 25.70/7.13 |
| Overs 7-14 | 29.50/7.19 | 39.12/7.82 | 22.84/7.24 | 31.27/7.96 |
| Overs 15-20 | 25.30/9.98 | 17.88/10.30 | 12.38/8.10 | 24.00/9.14 |
Over the last three years, there has been very little doubt as to who the best Twenty20 batsman is. Gayle has dominated the format wherever he has played and made a mockery of the belief that it is impossible to maintain both a high average and strike rate. He has tops-cored in the last two seasons of the IPL and is also one among the leading run-getters in the World Twenty20.
Among batsmen with 500-plus runs in the World Twenty20, Gayle's numbers stand out. He has an exceptional average of 47.21 while managing a stunning strike rate of 157.38. His preference to score in boundaries is clearly illustrated by the remarkably high value of the boundary-run percentage (72.91). Following his unbeaten 75 in the semi-final, Gayle has the most fifty-plus scores (7) in World Twenty20 matches. Gayle has hit 43 sixes in just 17 matches in the World Twenty20. Shane Watson, who is second on the list of batsmen with the most sixes in World Twenty20 matches, is a distant second with 27 sixes in 16 matches.
| Player | Matches/Innings | Runs | Average/SR | 4s/6s | Boun % | 50+ scores |
| Chris Gayle | 17/16 | 661 | 47.21/157.38 | 56/43 | 72.91 | 7 |
| Kevin Pietersen | 15/15 | 580 | 44.61/148.33 | 60/17 | 58.96 | 4 |
| Mahela Jayawardene | 24/24 | 825 | 41.25/139.35 | 89/22 | 59.15 | 6 |
| Tillakaratne Dilshan | 24/23 | 632 | 31.60/129.77 | 75/12 | 58.86 | 4 |
| Brendon McCullum | 21/21 | 552 | 29.05/126.60 | 62/14 | 60.14 | 2 |
| Gautam Gambhir | 21/20 | 524 | 26.20/118.01 | 61/6 | 53.43 | 4 |
| Kumar Sangakkara | 24/24 | 568 | 27.04/115.44 | 53/10 | 47.88 | 3 |
Gayle, who has mastered the art of run-scoring in the Twenty20 format, has preferred to score slow in the beginning of the innings before opening up. This has meant that his scoring rate against pace bowlers (8.17) is lower than that of most other batsmen. His opening partner Charles has looked ill at ease against quality pace and averages just 22.75 (four dismissals) while scoring at a run-rate of 6.42. Both Marlon Samuels and Kieron Pollard have high scoring rates against pace bowling but have also been dismissed on three occasions each.
Against spin, Gayle has been at his destructive best scoring at over 14 runs per over with nearly 85% of his runs coming in boundaries. Samuels has struggled to rotate the strike against spinners and as a result, has a low scoringrate (6.87). Pollard, who has been troubled by quality spin in the past, will draw some confidence from his last-over heroics against Xavier Doherty in the semi-final when he hit three consecutive sixes.
In the first semi-final, apart from Jayawardene, no other batsman exuded any confidence on the sluggish surface. Jayawardene, the highest run-getter in the World Twenty20, has looked comfortable against both pace and spin. Among Sri Lankan batsmen, Jaywardene has the highest boundary-run percentage against pace and spin (70.68% and 59.77% respectively). Dilshan, who scored 96 against West Indies in the 2009 semi-final, has had his problems against pace bowlers (four dismissals) but has still maintained a high scoring rate (8.73). Against spin, Dilshan has been dismissed just once but has a very low boundary-run percentage (38.96). Kumar Sangakkara, who is yet to have a major impact in the tournament, has demonstrated consistently high scoring-rates against both fast and slow bowlers.
| Batsman | Pace (Runs/Average) | Pace (SR/boun%) | Spin (Runs/Average) | Spin (SR/boun%) |
| Chris Gayle | 127/42.33 | 8.19/74.01 | 92/92.00 | 14.15/84.78 |
| Johnson Charles | 91/22.75 | 6.42/76.92 | 39/39.00 | 9.00/66.66 |
| Marlon Samuels |
96/32.00 | 8.86/64.58 | 55/27.50 | 6.87/65.45 |
| Kieron Pollard | 42/14.00 | 8.40/57.14 | 28/14.00 | 8.40/64.28 |
| Tillakaratne Dilshan | 99/24.75 | 8.73/62.62 | 77/77.00 | 6.79/38.96 |
| Mahela Jaywardene | 116/58.00 | 7.90/70.68 | 87/43.50 | 6.86/59.77 |
| Kumar Sangakkara | 81/40.50 | 8.83/46.91 | 67/33.50 | 7.58/47.76 |
| Angelo Mathews | 35/35.00 | 8.07/45.71 | 15/- | 9.00/40.00 |
As expected, the bowling stats for Sri Lanka have been dominated by their spinners. Mendis, who started with a bang with 6 for 8 against Zimbabwe, was expensive against New Zealand but returned to top form in the semi-final against Pakistan. Malinga, Sri Lanka's most successful Twenty20 bowler, bowled a brilliant Super Over against New Zealand and picked up 5 for 31 against England. Although the Sri Lankan pace bowlers have an excellent record (18 wickets at 24.22), they have been outperformed by the spinners. Overall, the Sri Lankan slow bowlers have 24 wickets at 13.25 but in the second innings, they have picked up 17 wickets at a scarcely believable average (9.29) and economy rate (6.32).
In crucial contests against Australia and England, West Indies produced excellent bowling performances after they were given the cushion of a big score. Spinners have been more successful for West Indies, who have bowled second in all but one match. They have picked up 15 wickets at an average of 24.06 and economy rate of 7.31. In contrast, the pace bowlers have 14 wickets at an average of 30.85 and economy rate of 8.49.
| Team | Bowler type | Wickets/avg (1st inns) | Econ rate (1st inns) | Wickets/avg (2nd inns) | Econ rate (2nd inns) | Wickets/avg (overall) | Econ rate (overall) |
| Sri Lanka | Pace | 9/24.55 | 8.18 | 9/23.88 | 6.61 | 18/24.22 | 7.32 |
| West Indies | Pace | 3/28.33 | 7.08 | 11/31.54 | 8.93 | 14/30.85 | 8.49 |
| Sri Lanka | Spin | 7/22.85 | 8.00 | 17/9.29 | 6.32 | 24/13.25 | 7.06 |
| West Indies | Spin | 3/14.66 | 6.28 | 12/26.41 | 7.48 | 15/24.06 | 7.31 |
Madhusudhan Ramakrishnan is a sub-editor (stats) at ESPNcricinfo