Australia's search for opening glory
Their opening combination used to be the best in the business, but over the last couple of years they have flagged a bit
S Rajesh
16-Nov-2012
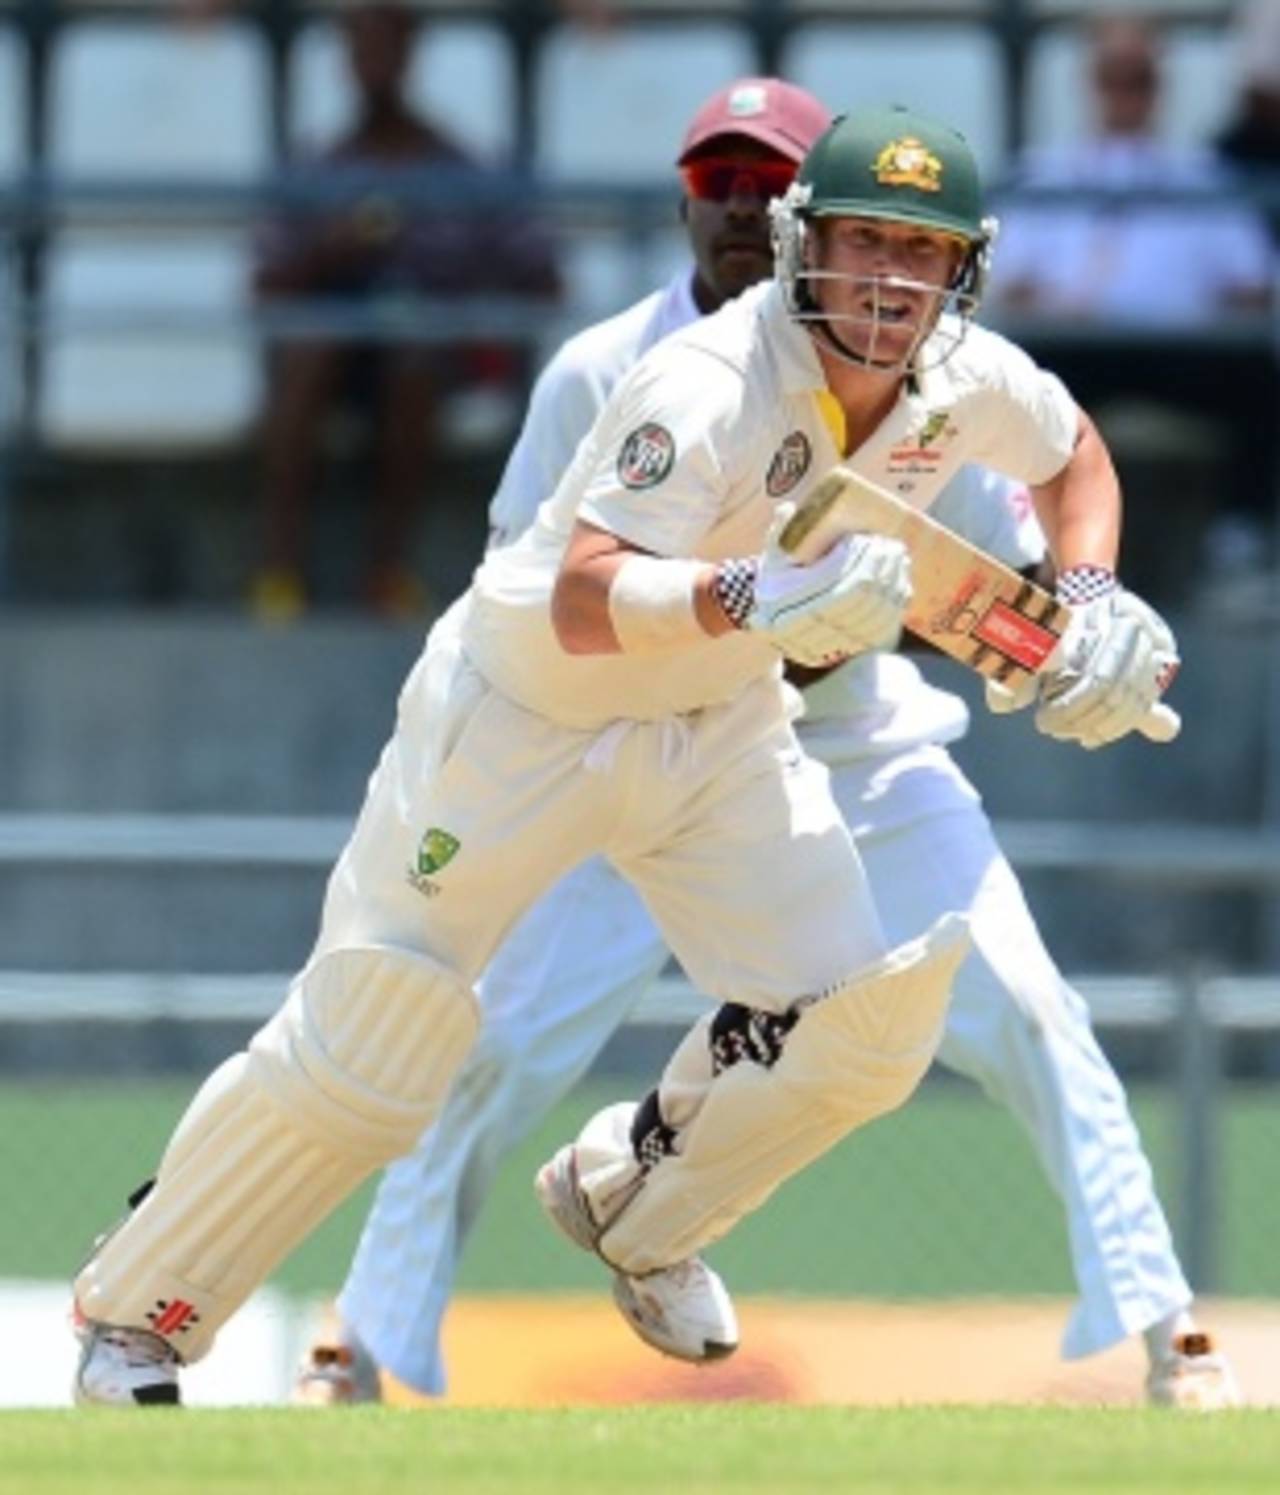
David Warner had a great start to his Test career, but his last few innings haven't been as prolific • AFP
Ed Cowan's 136 in the Brisbane Test against South Africa was a key one for both player and team. For Cowan himself, the century answered questions that had been raised about his place in the side after his ordinary series in the West Indies: in the previous eight innings he had passed 50 only once, and barely at that, scoring 55 in Roseau. In the context of the match, the Brisbane knock steadied Australia after a faltering start to their innings. More importantly, especially given the manner in which he constructed his innings, it's a step forward in Australia's search for a long-term opener.
When Matthew Hayden and Justin Langer were around, Australia's openers were easily the best among all teams. In the period between 2001 and 2009, Australia's openers averaged 51.43; the next-best average belonged to South Africa, 46.42. (These are the combined batting averages of the openers, not the average opening partnership.) In 386 Test innings, the Australian top two batsmen scored 58 hundreds - an average of 6.6 innings per century; the next-best century rates belonged to South Africa (8.4 innings) and England (8.8).
In the last two and a half years, though, the stats for Australia's opening batsmen have fallen away: since July 2010, in 88 innings their average has dropped to 34. Four teams have done better than that during this period, with England and South Africa averaging more than 40. Their rate of innings per century has dropped even more significantly - from one every 6.6 innings to one every 17.6. England have managed one every 8.2 innings, South Africa one every 6.9. The problem for Australia's openers has also been their conversion rate: five hundreds out of 20 scores of 50-plus (four out of 19 before Cowan's Gabba effort). England and South Africa have far better conversion rates.
| Team | Innings | Runs | Average | 100s/ 50s |
| England | 90 | 3763 | 43.75 | 11/ 14 |
| South Africa | 62 | 2435 | 41.98 | 7/ 11 |
| India | 102 | 3608 | 36.81 | 7/ 21 |
| Pakistan | 94 | 3022 | 34.73 | 6/ 13 |
| Australia | 88 | 2891 | 34.01 | 5/ 15 |
| Sri Lanka | 88 | 2749 | 33.52 | 5/ 16 |
| New Zealand | 62 | 1865 | 30.42 | 3/ 11 |
| West Indies | 80 | 2238 | 28.32 | 4/ 11 |
| Bangladesh | 22 | 599 | 27.22 | 0/ 4 |
However, while Australia's openers haven't got big runs individually, together they've got the team off to decent starts, averaging 38.56 runs per completed partnership, which is better than the averages for all teams except South Africa. Between 2001 and 2009, they averaged 52.50, which still wasn't good enough to win them top spot. (On another note, four teams averaged more than 47 during that period, while none have topped that mark in the last two and a half years, which suggests batsmen - especially those at the top of the order, haven't had it all their way recently.)
England's combined batting average for openers is high - thanks to Alastair Cook - but their average partnership drops to 36.53, largely due to Andrew Strauss' relatively poor form during much of this period: he averaged 32.39 to Cook's 56.14. England's partnership average is lower than Sri Lanka's, even though the combined averages of their openers is about ten runs higher. That also indicates that both of England's openers haven't often scored runs together.
Australia's openers have also been pretty consistent, though they haven't put together huge starts like some of the other sides have. In 44 partnerships during this period they've only managed two century stands, while England have four in 45 and India five in 51. However, Australia also have 13 partnerships of 50-plus, which means once in three tries they've given the team a start of at least 50 runs. For England, on the other hand, that ratio drops to one stand of 50-plus every five innings.
| Team | Innings | Runs | Average | 100/ 50 stands |
| South Africa | 31 | 1368 | 45.60 | 4/ 5 |
| Australia | 44 | 1697 | 38.56 | 2/ 13 |
| India | 51 | 1924 | 38.48 | 5/ 9 |
| Sri Lanka | 44 | 1577 | 37.54 | 2/ 11 |
| England | 45 | 1644 | 36.53 | 4/ 5 |
| Pakistan | 47 | 1493 | 33.17 | 4/ 8 |
| New Zealand | 31 | 1019 | 32.87 | 3/ 3 |
| West Indies | 40 | 1146 | 28.65 | 4/ 2 |
| Bangladesh | 11 | 266 | 24.18 | 0/ 1 |
Though Australia's average opening partnership is pretty decent, none of the Australians who've opened the batting during this period has an average of 40 or more, which should be a cause for concern. David Warner comes close, but after a bright start he has scored only 211 in his last nine innings, which has diminished his overall average to 39.60. Cowan's graph is moving in the opposite direction after his Gabba century, but he needs to string together more such performances.
Much has been written and said about Shane Watson's contribution as a batsman, but his numbers as a Test opener in the last two and a half years aren't all that impressive. In 27 innings he has scored only one century, which was two years ago in India. His inability to convert fifties into hundreds has also hampered his, and Australia's, overall opening numbers. Phil Hughes is the other batsman who has had a go at the top of the order, but his technical flaws have been exposed far too often.
| Batsman | Innings | Runs | Average | 100s/ 50s |
| Shane Watson | 27 | 952 | 36.61 | 1/ 7 |
| David Warner | 17 | 594 | 39.60 | 2/ 1 |
| Ed Cowan | 13 | 494 | 38.00 | 1/ 3 |
| Phil Hughes | 19 | 457 | 24.05 | 1/ 1 |
| Simon Katich | 12 | 394 | 32.83 | 0/ 3 |
Overall, there are six openers who have scored 400-plus runs at 40-plus averages since July 2010, but only two of them average more than 45, which is again an indication of the relatively tough times for opening batsmen recently. One of those two batsmen, Chris Gayle, has played only nine innings to achieve that average, and 333 of his 620 runs came in one innings, against Sri Lanka in Galle. Cook is the only opener who has been consistently prolific during this period, with eight hundreds in 45 innings and an average exceeding 56. None of the Australian batsmen figure among these six, but if a couple of them sneak their way in over the next couple of Tests against South Africa, they will have done their team, and themselves, a huge favour.
| Batsman | Innings | Runs | Average | 100s/ 50s |
| Chris Gayle | 9 | 620 | 77.50 | 2/ 1 |
| Alastair Cook | 45 | 2358 | 56.14 | 8/ 7 |
| Alviro Petersen | 23 | 968 | 44.00 | 3/ 3 |
| Graeme Smith | 30 | 1177 | 43.59 | 4/ 6 |
| Virender Sehwag | 41 | 1732 | 43.30 | 4/ 11 |
| Mohammad Hafeez | 35 | 1282 | 41.35 | 3/ 5 |
S Rajesh is stats editor of ESPNcricinfo. Follow him on Twitter