A tournament of runs and sixes
While seamer Anya Shrubsole's six-for was the defining performance of the final, the rest of the tournament was largely dominated by the batsmen
S Rajesh
Jul 24, 2017, 3:33 PM
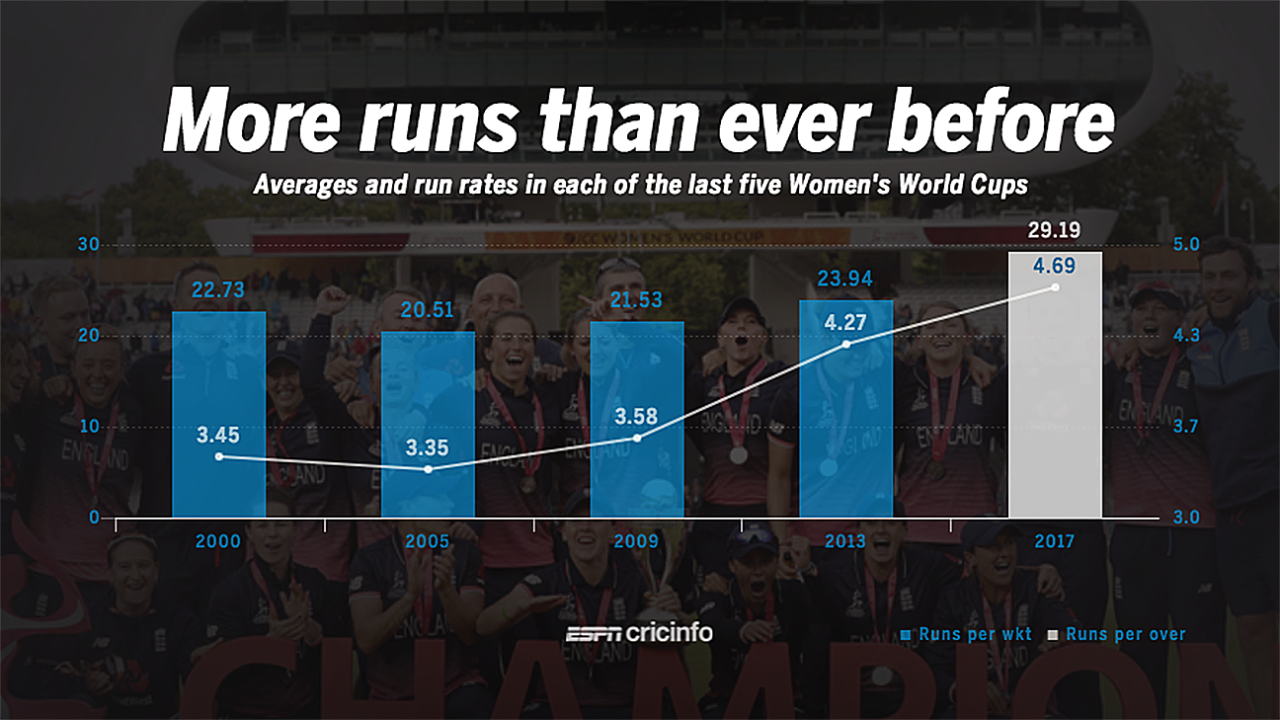
The average and run rate in the 2017 World Cup witnessed a significant increase compared to earlier editions • ESPNcricinfo Ltd
4.69 - The run rate over the entire tournament, the highest in any Women's World Cup. It was a 10% increase over the run rate in the previous edition (4.27 in India in 2013), and a whopping 31% increase over the run rate of 3.58 in the 2009 edition in Australia. The average runs per wicket went up significantly too: from 23.94 in 2013, it increased to 29.19, a rise of 22%.
15 - Totals of 250 or more in the tournament, the most in a World Cup, and almost twice as many as the previous highest: in 2013, there were eight such totals. The 2017 edition had 30 matches compared to 25 in 2013 (excluding washouts), but that still translates to one 250-plus total every four innings this time, compared to one every 6.25 innings in 2013, an improvement of 36%.
111 - Sixes hit in the tournament, the first time 100-plus sixes have been struck in a Women's World Cup. The previous highest was 67, in the 2013 edition in India. (Complete boundary information for the World Cups before 2000 is not available, but in the 2000 edition, there was a grand total of eight sixes hit in 31 matches, at an average of one every 2074 balls.) There were also 1272 fours struck in the 15,826 balls bowled in this tournament, which means there was a four or a six scored every 11.44 balls. That is almost exactly the same rate of scoring boundaries as in the previous World Cup in 2013 (11.50), but it was a big improvement over the previous editions. The rate of hitting sixes, though, improved by almost 27% over the previous edition. In terms of percentage of runs scored in boundaries, the 2017 edition ranks second with a percentage of 49.27, below the 2013 percentage of 54.45.
| Year | balls per 4/6 | balls per 6 | % bound runs | Inns/50+ score |
| 2017 | 11.44 | 142.58 | 49.37 | 7.44 |
| 2013 | 11.50 | 194.42 | 54.45 | 10.52 |
| 2009 | 18.71 | 279.51 | 40.36 | 13.88 |
| 2005 | 26.34 | 862.20 | 31.00 | 14.40 |
| 2000 | 19.12 | 2074.00 | 40.63 | 12.05 |
70 - Fifty-plus scores in the tournament, the highest among all editions; the next best is 44, in 2013. There were 14 hundreds scored, which is also a record, going past the earlier best of 11 in 2013. Fifty-plus scores were also made more frequently in this World cup than in previous editions, with an average of one 50-plus score every 7.44 innings. The next best is 10.52, in 2013.
5 - Of the top ten scores in Women's World Cup matches came in 2017, which is another indicator of batsmen dominating the tournament. Chamari Atapattu's unbeaten 178 is the second-highest World Cup score, while Harmanpreet Kaur made 171*, Meg Lanning 152*, Tammy Beaumont 148 and Sarah Taylor 147. In no other World Cup have there been more than three 140-plus scores in a single edition.
5.64 - England's run rate in the tournament, the best among all teams. Two other teams scored at more than five an over - Australia (5.41), and New Zealand (5.14). The losing finalist, India, scored at only 4.69 per over, but they were superb with the ball, conceding only 4.46 per over, which was better than the economy rates for England (4.53) and Australia (4.58). England also topped in terms of most fours (242) and hundreds (five).
| Team | W/ L | Bat ave | Run rate | Bowl ave | Econ rate |
| England | 8/ 1 | 37.71 | 5.64 | 29.19 | 4.53 |
| India | 6/ 3 | 33.06 | 4.69 | 24.26 | 4.46 |
| Australia | 6/ 2 | 42.00 | 5.41 | 26.67 | 4.58 |
| South Africa | 4/ 3 | 31.81 | 4.91 | 22.55 | 4.43 |
| New Zealand | 3/ 3 | 29.23 | 5.14 | 25.02 | 4.33 |
| West Indies | 2/ 5 | 20.45 | 3.88 | 41.18 | 4.89 |
| Sri Lanka | 1/ 6 | 22.81 | 4.04 | 40.80 | 5.06 |
| Pakistan | 0/ 7 | 18.24 | 3.45 | 38.54 | 5.40 |
410 - Aggregate for England's opener Tammy Beaumont, who was the top scorer in the tournament. In terms of aggregates in a single World Cup, though, Beaumont's is joint fifth. The highest remains Debbie Hockley's 456 runs in the 1997 edition. For the bowlers, the highest haul of 15 wickets, by South Africa's Dane van Niekerk, is the joint 11th-highest in a single World Cup.
73 - Wickets taken by India, the most by a side in the tournament. England, the only other side to play nine matches in this World Cup, managed 66 wickets while Australia took 67. India's spinners were also the leaders with 44 wickets, well clear of Australia's, who were next with 32.
S Rajesh is stats editor of ESPNcricinfo. @rajeshstats