No, par score is not what you have been thinking it is all this while
It is not the average score at a venue. It's not the scoring rate. And it's not the perfect winning score
Anantha Narayanan
15-Mar-2019
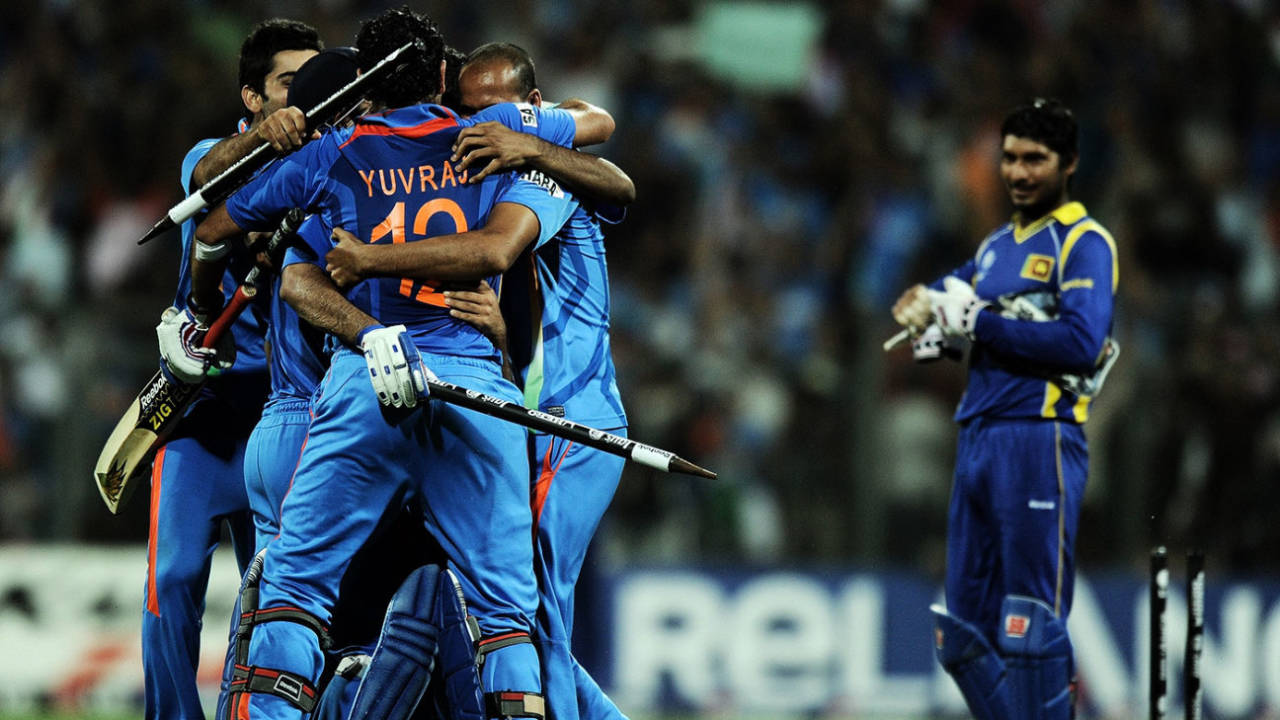
At the 2011 World Cup final, India were impressive to chase down Sri Lanka's 274, which was the batting par score for that time • AFP/Getty Images
A young, wet-behind-the-ears, Richie Benaud was talking to Keith Miller, the mercurial allrounder, on what it was like to bowl at the great Don Bradman. "Gosh, if only I could have bowled against Bradman!" sighed Benaud. Miller gave him a long penetrating stare and said, "Everyone has a break, son, and that is yours". - from Aggers' Special Delivery by Jonathan Agnew and Nick Constable
With the much-awaited World Cup around the corner, about 75 days away, I will concentrate on the ODI format a little more for now. During this period, I intend to come out with the completely revised ODI Performance Ratings and will weave in some World Cup stories around that fascinating topic. I will end with a performance review of the 2019 World Cup.
In this article, I will take a fresh look at one of the most misunderstood and misinterpreted concepts in the ODI game - namely, the par score. I have seen no fewer than five definitions on various broadcasting channels and from what I have seen and read, there has been no clear attempt to define and establish the concept of par score, not just for the batting team but for the bowling team as well.
First, let me define what is not par score.
- It is not the average score in the location concerned. That is only a fact but not what the teams should aim for.
- It is not a perfect winning score. In that case, for the batting team, it should be 439 (one more than the highest second innings score ever reached) and for the bowling team 124 (one less than the lowest total successfully defended in non-D/L matches). However, these are totally unrealistic targets.
- These are not scores that are at the middle or the extremes. Par scores should be realistic values and teams should plan around these values.
Let me redefine the par score. It is the score that gives the concerned team a 66.67% chance of winning. That is a very reasonable expectation and represents neither an ultra-conservative nor a hyper-aggressive view. Planning towards the par score, based on this definition, is realistic for most teams. In any team sport, an overall two-thirds expectation of winning is very reasonable. Going for a 50% winning chance is not really enough if the teams look at securing a clear advantage in the first innings of the match. And 75-80% seems too ambitious other than when a strong team plays a weaker team.
A few ground rules, as usual.
1. All D/L matches will be excluded. D/L makes a complete mess of any estimation and objective calculations. The need for D/L is very clear. However, I do not want those non-linear calculations to mess up my work. Unfortunately, this list excludes the Bangladesh-India ODI in Mirpur in 2014, in which India successfully defended 105. But there was a rain interruption and D/L came into play. I will not make any ad-hoc tweaks to include matches like this.
2. All no result and tied matches are excluded. Quite a logical point here. We are interested only in results. Not in any Super Overs or bowl-outs.
3. I am looking at par score, not a par scoring rate. The scoring rate goes up automatically when the number of overs are reduced and goes down when the overs are more. The par score is likely to be 250 whether the maximum overs are 40 or 50. Hence I will only look at the score. However, I will exclude all matches in which the maximum overs are fewer than 35. I have no interest in, say, 25-over matches since everything changes dramatically.
4. What matters is the score, not overs. If a score of 150 was defended successfully, it does not matter whether the team took 40 overs or 50 overs to do it. This will let me handle the quirky situation that a 39-over all-out innings should be considered to be a 50-over innings. Similarly, if an innings of 280 is successfully chased down, it does not matter how many overs were taken to score the 281.
Even with all these restrictions, I have on hand no fewer than 3615 out of the 4112 matches played until March 10, 2019, which is the cut-off for this article. That is a very good sample size of around 88%.
I will group the matches into the following periods and do the analysis for the concerned periods as well as for the whole.
- 1971 to 1987: 482 matches
- 1988 to 1996: 672 matches
- 1997 to 2002: 773 matches
- 2003 to 2007: 733 matches
- 2008 to 2013: 790 matches
- 2014 to 2019: 662 matches
- 1971 to 2019: 4112 matches
- 1988 to 1996: 672 matches
- 1997 to 2002: 773 matches
- 2003 to 2007: 733 matches
- 2008 to 2013: 790 matches
- 2014 to 2019: 662 matches
- 1971 to 2019: 4112 matches
I will use the first-innings score for further grouping. There is a low-score group of 0-99, ten 20-run groups covering the heavily populated range of 100 to 299 and high-score groups of 300-324, 325-349, 350-399 and 400-499. Thus, there are a total of 15 groups.
Once the matches are classified, the results are posted. I will then identify the two classes that are either side of 66.67% winning percentage and extrapolate the class interval values to arrive at the batting par score. The same process, locating the two classes either side of 33.33%, will give the bowling par score. Since these key classes are highly populated and are always on an increasing trend, these calculations work very well.
Let me explain this concept using the raw data of one period: 2003-2007.
| Group | MidPt | Matches | FB-Wins | Win-% |
|---|---|---|---|---|
| 35 - 99 | 67 | 16 | 0 | 0.0% |
| 100-119 | 110 | 13 | 0 | 0.0% |
| 120-139 | 130 | 24 | 1 | 4.2% |
| 140-159 | 150 | 30 | 1 | 3.3% |
| 160-179 | 170 | 29 | 3 | 10.3% |
| 180-199 | 190 | 52 | 9 | 17.3% @ |
| 200-219 | 210 | 64 | 22 | 34.4% @ |
| 220-239 | 230 | 85 | 38 | 44.7% |
| 240-259 | 250 | 93 | 49 | 52.7% # |
| 260-279 | 270 | 74 | 55 | 74.3% # |
| 280-299 | 290 | 63 | 45 | 71.4% |
| 300-319 | 310 | 46 | 40 | 87.0% |
| 320-349 | 335 | 38 | 33 | 86.8% |
| 350-399 | 375 | 16 | 16 | 100.0% |
| 400-481 | 441 | 4 | 3 | 75.0% |
The 66.67% value is calculated by the following formula, which is self-explanatory.
Batting par score (#) = 250+20*(66.67-52.7)/(74.3-52.7) = 263
The 33.33% value is calculated by the following formula.
Bowling par score (@) = 190+20*(33.33-17.3)/(34.4-17.3) = 209
The interpretation is that during the period 2003-07, a first-innings score of 263 would have given the batting team a winning percentage of 66.67%. Hence it is called the batting par score. Au contraire, a first-innings score of 209 gives the batting team a winning percentage of 33.33%. This works out to 66.67% for the bowling team since this is a results-only analysis. Hence it is called the bowling par score.
It is clear that these numbers are across 700+ matches and have a good level of statistical backing associated with them. However, the real-life situation is that there are over 100 grounds and 25 teams involved and the lower-level results might be quite different, especially as population size reduces dramatically.
There lies the crux of the matter. I am presenting an idea. The idea is valid across any well-populated group. If required, take a group of locations or team and work out the batting and bowling par scores. The whole thing will work quite well. However, it should be remembered that taking, say, only five or ten matches, will not work. As of now, let us think of this as a very nice globally valid number. The batting par score of 263, determined across the globe during the years 2003-2007, might change to 275 in India and 250 in New Zealand.
As a historical measure, par scores have a lot of value in evaluating performances. As a current measure, the teams would have a firm target to work towards, with a reasonable level of confidence. As we look at the most recent period, there will be utter clarity on what teams should go for today.
Now, let us view the results on graphs.
There are no surprises when we view the graph for the first 17 years of ODI cricket. The batting par score is a middling 252. Note how the extrapolation work has been done. When we come to the bowling par score, that is a very low value of 191. That means one-third of sub-191 scores were successfully defended. These relatively low numbers are very important in the ratings calculations. A hundred that helped the team reach a winning score of 250+, such as Graham Gooch's 115 in the 1987 World Cup semi-final in Mumbai, was a lot more valuable those days than today. There were only 15 instances of 300+ scores in the first innings. Not one of these scores was chased down. The lowest total successfully defended was India's 125 (in the face of Imran Khan's 6 for 14) and that has held its place for over 33 years.
Quite a few matches were played over 55 and 60 overs, or 40 overs. However, towards the later part of the period, the maximum overs settled at 50 overs. No fewer than four World Cups were conducted during this period.
The tight situation on scores continued during the nine years ending just after the 1996 World Cup. If anything, the batting par score went down by three runs. It is worthwhile to remember that during the first two periods, terrific attacking batsmen like Viv Richards and Kapil Dev were scoring at strike rates exceeding 90. These scores put the achievements of these giants in perspective. During this period, there were 29 300+ scores and for the first time in history, a 300+ score was chased down successfully - at the 1992 World Cup when Sri Lanka chased down Zimbabwe's first-innings total of 312 for 4 in New Plymouth, New Zealand.
There were two World Cups in this period. For the first time in history, a World Cup was won chasing down a total. Until then it had been a question of bat first and win in World Cup finals.
Slowly, the situation changed as batsmen started attacking in the opening hours. Opening batsmen had different mindsets. In the last decade before the millennium, the batting par score moved up by 14 runs. That is a very significant move indeed, considering that this change occurred over 700 matches. There was a much higher increase of 23 runs in the bowling par score: It went up to 215. Defending low-to-middling scores was going out of fashion. Incidentally, the greatest change occurred during this period. There were 72 300+ scores and eight of these ended on the losing side. Slowly, the scenarios were changing. You did not score 300 and settle down to win.
In the matches either side of the millennium, the batting par score remained steady at 263, the same as the previous period. The bowling par score even took a drop, to 209. Maybe the bowlers were learning newer tricks. In a way, it is a surprising trend that the par scores numbers took a drop. Did the lacklustre 2003 World Cup have anything to do with this trend? There were over 100 300+ scores and 12 of these ended on the losing side. Lo and behold, this included the first occurrence of a 400+ score, which was promptly chased down. The scenarios were changing further. A score either side of 330 produced only an 87% chance of winning.
During the second period of the new millennium, the batting par score moved up by 11 runs to a sizeable figure of 274. Teams had to plan to score at well over the previous norm of around five runs per over. However, the real change occurred at the bowling par score. It went up by a whopping 25 runs to 234. The gap between the batting and bowling par scores was a low 40 runs. This seems to be a special trait of this period. This is also the decade in which T20 made its mark. Maybe the bowlers needed the 20 additional runs since lower totals were becoming indefensible. The number of 300+ scores went up in a big way, to 125. No fewer than 17 of these were chased down.
This is the current period. The batting par score took a quantum leap to 294 runs. That means, when the teams started their innings, they had to look at scoring 300 to have any reasonable chance of success. During these two periods many rule changes came into force, further shackling bowlers. The free-hit, penalising of real short balls, the bringing in of the boundaries, etc. Surprisingly, the bowling par score remained almost steady. One possible reason could be the introduction of many teams at lower rungs and the high number of matches between these teams. The gap between the two par scores went up to 62. Teams crossed 300 in their first innings no fewer than 159 times, but finished on the losing side on 28 of these.
The overall numbers across all 3615 matches are as expected. The batting par score is 266 and the bowling par score is 206. These are only useful in an academic manner. The sample size, while it is huge, cuts across 47 years, over 200 grounds, myriad rule changes and myriad strategy changes. As such, it is difficult to use these numbers, except as a datum point. However, across these 4000+ matches, the lowest score defended stays at 125 and the highest score chased is 434.
The summary graph indicates how the par scores have changed across the periods. We are able to see the low gap between the batting and bowling par scores that existed in period 4. We can also see that the bowling par score has undergone more changes than the batting par score.
It is clear that the batting par score for the next period, say from 2020 to 2025, will be well in excess of 300. Maybe a couple of more 400+ scores will be chased down. West Indies nearly won while chasing a 400+ score against England in Grenada last month.
Let me now do a micro-analysis of the 11 World Cup finals.
There were seven defending wins so far: The winning scores being 291, 286, 183, 253, 249, 359 and 281. Out of these, other than the way-below-par 183, which was enough for India, the other six scores were at or above the batting par scores of the concerned periods. The only close match in these seven finals was the 1987 match in which the winning margin was seven runs.
There were four chasing wins: The chased score being 241, 132, 274 and 183. Out of these, the only odd one out is Sri Lanka's 274, which was exactly the same as the batting par score for the concerned period. Logically, Sri Lanka should have won the 2011 World Cup. Maybe there were some captaincy errors. An over or two of Lasith Malinga at the appropriate time or setting the right field when a catch was expected and who knows the result might have been different? However, to their credit, India held their nerve and completed a very tough win.
It is nice to see that there was only one major upset and one coming-from-behind win in the World Cup finals. And India was the winning team in both these instances.
An important note to the readers.
An update on the batting and bowling performance ratings
Over the next three to four months, I will completely re-work the the performance ratings (GW25/RC25) processes incorporating the valid suggestions provided by readers. This is a good time to do this since I expect to have four of my next five articles (including this one) relating to the ODI game, with special reference to the World Cup. I may publish the revised GW25/RC25 tables during the latter half of the year when the Test season will be in full swing. It also helps that virtually no Tests will be played during this coming period.
Over the next three to four months, I will completely re-work the the performance ratings (GW25/RC25) processes incorporating the valid suggestions provided by readers. This is a good time to do this since I expect to have four of my next five articles (including this one) relating to the ODI game, with special reference to the World Cup. I may publish the revised GW25/RC25 tables during the latter half of the year when the Test season will be in full swing. It also helps that virtually no Tests will be played during this coming period.
1. Use Pitch Quality Index (PQI) for innings 1/2 and 3/4 separately as against the match-PQI. This will fine-tune both GW25 and RC25 work. One example will suffice to bring out the value. In Abu Dhabi in 2017-18, the scores were 419, 422, 138 and 114. The currently used PQI-Match is a benign 50.9, hiding a whole lot of turbulence underneath. The PQI-12 is 70.6 and PQI-34, 24.9. Herath's 5/93 in the second innings and Dickwela's 40 in the third innings will be valued at much higher levels.
2. Split the career-to-date away averages (Ctd_Away) into Ctd_Asia and Ctd_Others. This will ensure that the batting and bowling quality will be correctly measured.
3. Use team bowling strength rather than weighted actual-spells-based numbers. The recurring problems of lesser bowlers bowling a number of balls and lowering the bowling quality will disappear.
3. Introduce recent form (adjacent 10+ innings/spells). This is very important. For all their great career numbers, Hashim Amla and Dale Steyn have had poor recent form values and this will bring the right perspective to the batting and bowling quality determination. The term "recent" will cover the latter Tests in the concerned series.
4. Factor in the margin, especially for losses, more importantly, close losses. A seven-run loss will be treated as a much closer Test than a 300-run loss. As such, those batsmen and bowlers who perform well in such tight contests will be rewarded.
5. Re-look at handling the innings size - Using Batsman Score redundancy (Real value of runs scored). I must confess that this concept is quite unclear at this stage. The idea is to ensure that those huge scores are toned down. The value of the last 100 runs in innings such as Matthew Hayden's 380 or Mahela Jayawardene's 374 or Len Hutton's 364 is doubtful.
6. Make more sense out of "Runs added with late order" parameter. I will evolve this fascinating area to manageable ideas using partnership analysis, valuation of late-order runs, integration with match status, building in of late-order player quality et al. Maybe this will be the most tweaked parameter of all.
7. Introduce an X-Factor. These are outside the normal match situations. Innings after follow-on, great defensive innings, series situation, good-as-gold low scores, etc, are some of the ideas for special consideration.
Readers can comment on this article here. Note that this link takes you outside ESPNcricinfo, and ESPNcricinfo does not monitor, publish, or otherwise associate itself with comments posted there.
Anantha Narayanan has written for ESPNcricinfo and CastrolCricket and worked with a number of companies on their cricket performance ratings-related systems