Best and worst venues for batting first
A look at grounds with the highest and lowest averages for the team batting first in Tests
S Rajesh
23-Jul-2010
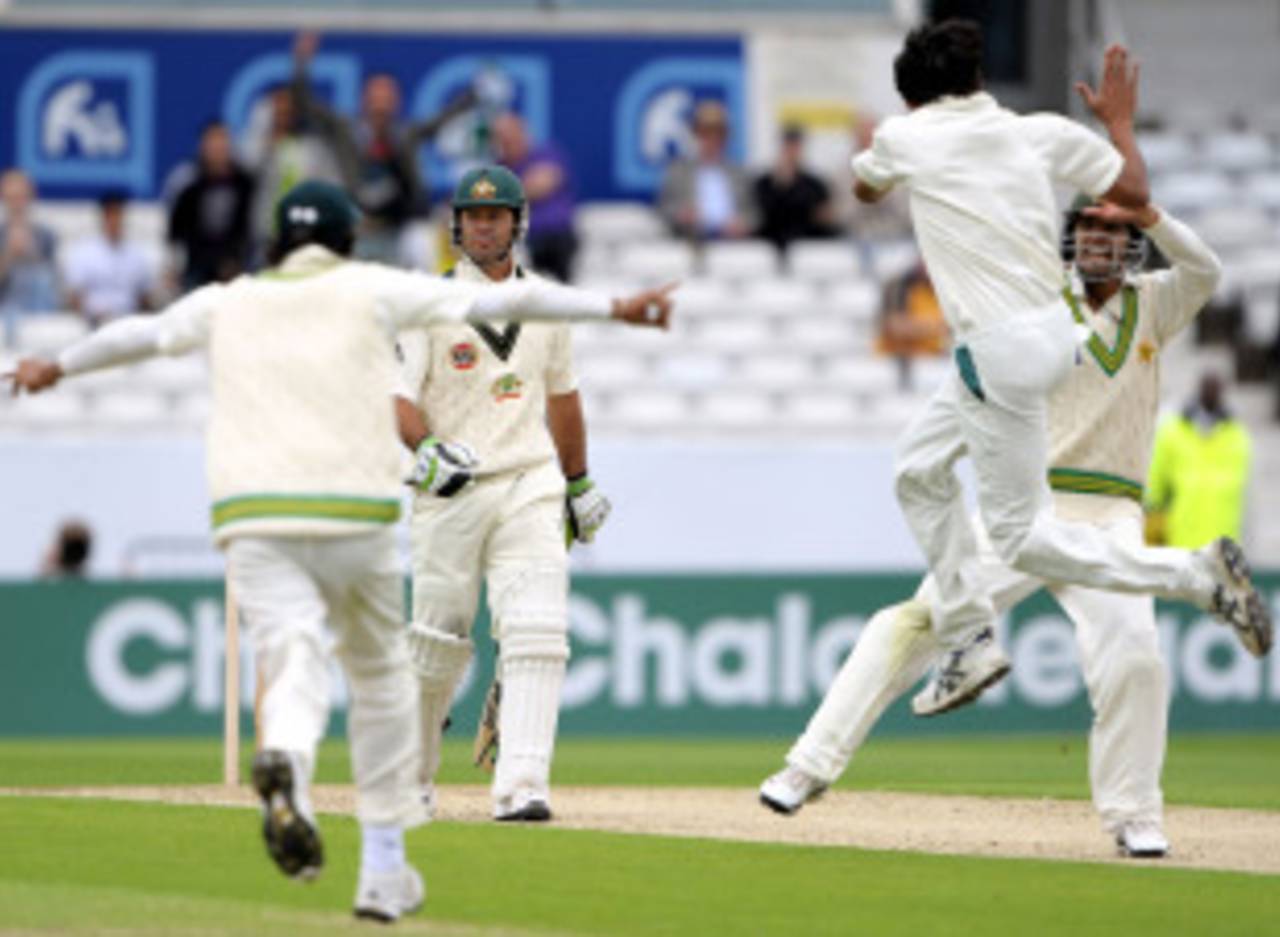
Ricky Ponting and Co had no answers to Pakistan's fast bowlers in the first innings at Headingley, but the venue hasn't always been a haven for bowlers in the first innings • Getty Images
Ricky Ponting's decision to bat first after winning the toss at Headingley drew some flak, especially after the move backfired so spectacularly. Overnight rain had spiced up the conditions significantly, and there was also the weight of recent history to dissuade the call to bat: in the two previous Tests there, the teams batting first had suffered resounding defeats. In 2009, England were beaten by an innings and 80 runs after crumbling for 102 in their first innings - they'd won the toss too - while in 2008, South Africa chose to field, bundled England out for 203, and cruised to a ten-wicket win.
So does that mean that Headingley is one of the worst venues to bat first? Unfortunately for Ponting, Headingley has been one of those venues that has been anything but predictable in its behaviour. In the three Tests there preceding the 2008 one, the teams batting first all scored in excess of 400, with even New Zealand managing 409 (though they ended up losing the match). England made 500-plus scores twice, winning both times. And in 2002, Sourav Ganguly made a bold decision to bat first in seaming conditions and the Indian batsmen justified the faith reposed in them by scoring 628 in the first innings. In fact, Headingley has been the kind of venue where teams batting first either score a lot or very little: in the last 10 Tests there, teams have scored in excess of 400 five times, and four times they've been bowled out for less than 210.
So which are the venues where the teams batting first have consistently struggled, or consistently done well? The next two tables list the venues.
The two grounds with the lowest averages are both venues where the quality of the host nation has significantly affected the numbers. At the Bangabandhu Stadium in Dhaka, Bangladesh have batted first in seven out of nine Tests that have been played there since 2000. That, to a large extent, explains a runs-per-wicket average of less than 21. It's a similar story in Bulawayo, where Zimbabwe have batted first eight times out of 11, and Bangladesh twice. Among other venues, New Zealand's Eden Park in Auckland has been the most difficult for teams batting first, with Kandy a close second. In six Tests at Eden Park since 2000, the team batting first has been bowled out for less than 300 five times (though on three of those occasions they've gone on to win the match). Kandy has been similarly difficult, with four sub-200 totals and only one 400-plus score in 13 matches.
The rest of the top 10 has a couple of venues from India, where you'd expect the conditions to be relatively favourable to the team batting first. In Mumbai, the average runs per wicket is only 26.34, while Chennai has averaged 28.68, with the team batting first not winning a single Test out of the last six. However, there are no venues from England or Australia in the top 10, despite the commonly held notion that some of the venues in those countries are pretty difficult for teams batting first. (The lowest for England is Trent Bridge, with an average of 30.88, while Australia's lowest is Sydney, where the first-innings average is 35.88.) Australia's relatively high numbers are also because of their exceptional batting line-up over the last decade.
| Venue | Tests | 1st inngs runs | Average | 100s/ 50s | Highest/ Lowest |
| Bangabandhu National Stadium, Dhaka | 9 | 1872 | 20.80 | 1/ 11 | 400/ 107 |
| Queens Sports Club, Bulawayo | 11 | 2752 | 25.24 | 1/ 15 | 481/ 155 |
| Eden Park, Auckland | 6 | 1521 | 25.35 | 1/ 9 | 346/ 202 |
| Asgiriya Stadium, Kandy | 13 | 3178 | 25.42 | 5/ 15 | 467/ 120 |
| Wankhede Stadium, Mumbai | 5 | 1291 | 26.34 | 3/ 5 | 457/ 104 |
| Kingsmead, Durban | 10 | 2856 | 28.56 | 6/ 17 | 420/ 139 |
| Sabina Park, Kingston | 10 | 2857 | 28.57 | 5/ 16 | 431/ 200 |
| MA Chidambaram Stadium, Chennai | 6 | 1721 | 28.68 | 3/ 8 | 540/ 167 |
| St George's Park, Port Elizabeth | 5 | 1451 | 29.02 | 4/ 4 | 408/ 124 |
| P Sara Oval, Colombo | 8 | 2243 | 29.51 | 4/ 12 | 515/ 62 |
And at the other end of the spectrum are the grounds that offer nothing for bowlers, and where batting first is usually a boon. The venue on top of this list is surprise to no one: the Antigua Recreation Ground has for years given bowlers nothing but heartbreak, and in eight games here since 2000, batsmen average 47.59 in the first innings. Four times teams have declared after scoring more than 500, and compared to one century in six matches in Auckland, Antigua has produced 11 in eight.
The next venue on the table also has a history of consistently high first-innings totals, though it's also a huge credit to Les Burdett, the curator at the Adelaide Oval, that eight out of 10 Tests here during this period have produced a decisive result. And while Australia's strong batting is obviously a factor, they've only batted first in three of these 10 games, which shows that conditions have helped all teams batting first. In Brisbane, the story is slightly different: the high average is largely due to the home team's batting - in eight out of 10 matches here Australia have batted first; in the two other innings New Zealand made 353, and West Indies were bundled out for 82.
Also in the top 10 are three Indian venues, which is more in keeping with the general perception of conditions in the country, and The Oval in London, where the first-innings total has exceeded 400 five times in the last 10 Tests.
| Venue | Tests | 1st inngs runs | Averages | 100s/ 50s | Highest/ Lowest |
| Antigua Recreation Ground, Antigua | 8 | 3284 | 47.59 | 11/ 9 | 751/ 240 |
| Adelaide Oval, Adelaide | 10 | 4289 | 45.62 | 11/ 16 | 575/ 270 |
| Brisbane Cricket Ground, Brisbane | 10 | 3813 | 42.36 | 12/ 15 | 602/ 82 |
| Gaddafi Stadium, Lahore | 10 | 3878 | 41.25 | 11/ 13 | 679/ 206 |
| Eden Gardens, Kolkata | 6 | 2269 | 41.25 | 8/ 9 | 616/ 296 |
| M Chinnaswamy Stadium, Bangalore | 6 | 2450 | 40.83 | 9/ 5 | 626/ 158 |
| Punjab CA Stadium, Mohali | 6 | 2267 | 40.48 | 7/ 10 | 630/ 238 |
| The Oval, London | 10 | 3794 | 40.36 | 7/ 23 | 664/ 173 |
| McLean Park, Napier | 6 | 2132 | 40.22 | 8/ 8 | 619/ 223 |
| Galle International Stadium, Galle | 14 | 5134 | 39.49 | 12/ 23 | 522/ 181 |
All averages and runs scored exclude extras.
S Rajesh is stats editor of Cricinfo