Friday night lights
Over the last six years, batting second in day-night matches has been much more profitable than before
S Rajesh
23-Mar-2012
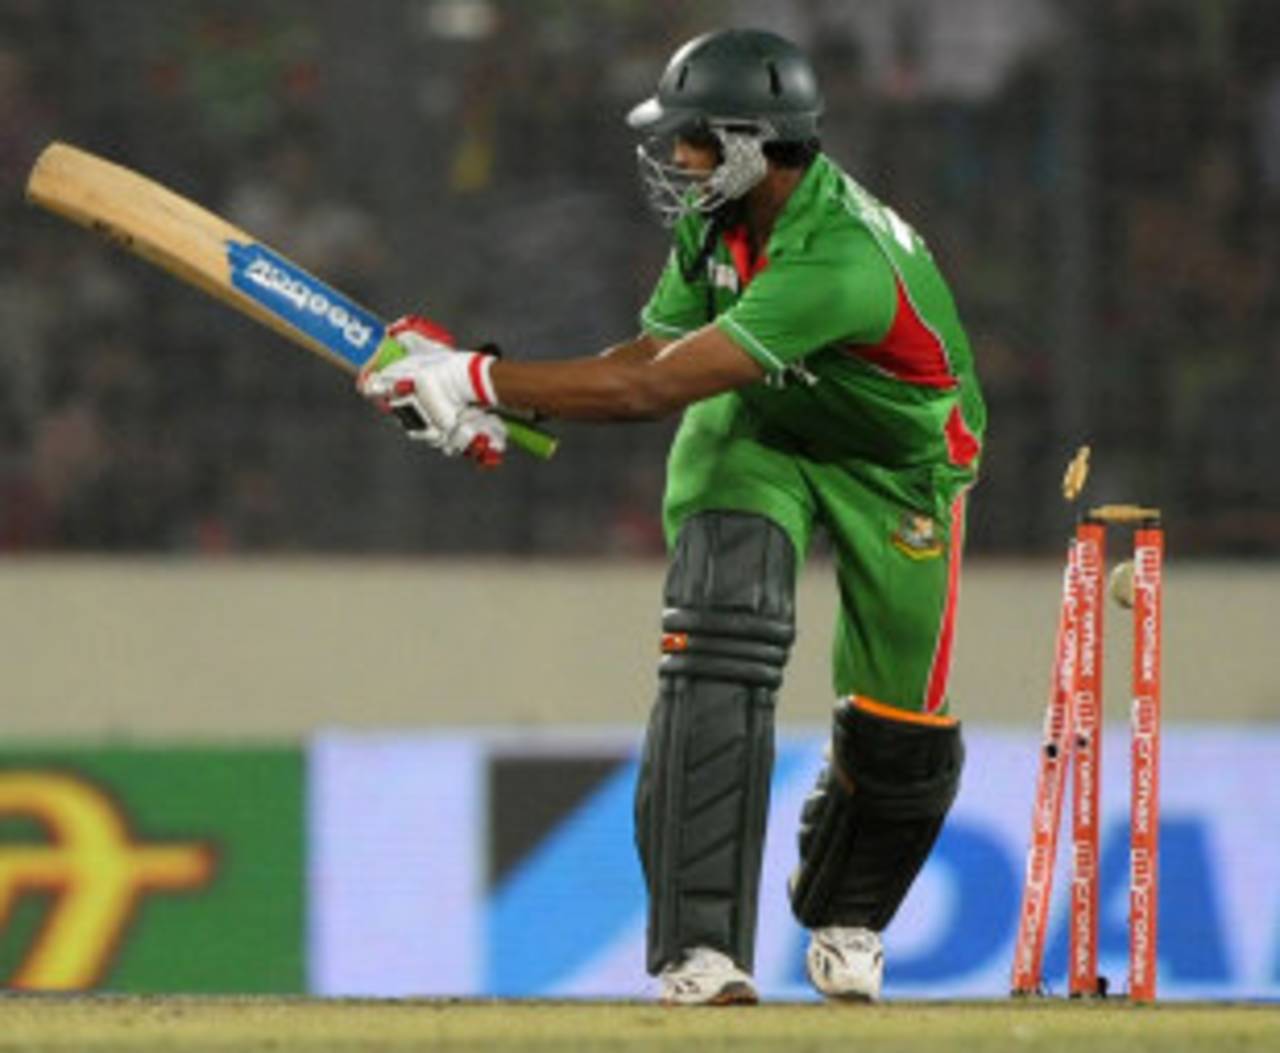
Despite Bangladesh's defeat in the Asia Cup final, Mirpur remains an excellent venue to bat second under lights • AFP
Pakistan batted first and squeaked through in the final of the Asia Cup, but one of the features of the tournament was the advantage that the team chasing seemed to have. The ball seemed to come on to the bat in the evening under lights making strokeplay much easier, and it showed in the results through the round-robin stage of the tournament. After falling short in the first two matches, the teams chasing won each of the next four - it started with Pakistan's easy win against Sri Lanka, and then continued as Bangladesh shocked India, who in turn beat Pakistan in a stunning chase of 330. Not to be outdone, Bangladesh chased down 212 with 17 balls out of their 40 overs remaining to sail into the final, and then nearly pulled off the run-chase in the decider as well.
Going back a little further, these last few months have been excellent ones for teams chasing, especially in day-night ODIs: India pulled off that incredible chase against Sri Lanka in Hobart, while Sri Lanka have been terrific themselves, chasing down a target of 300 in Kimberley, and then beating Australia in tough run-chases in Hobart and Adelaide. All these results have made 2012 one of the best years for the team batting second in day-night ODIs: in 34 such matches so far this year, the teams chasing have won 18 and lost 15, a ratio of 1.20.
Batting second in day-night ODIs has been a pretty successful formula recently, but it wasn't always so. The overall numbers, in fact, remain favourable for the team batting first in these matches: the team batting second has lost more often than it has won (507 wins, 584 defeats). In comparison, chasing has historically been a more profitable option in day games (1108 wins, 933 defeats).
Even in the period between 2000 and 2005, batting first was clearly the better option when playing under lights. As compared to a 237-175 win-loss ratio for the teams chasing in day games, in day-night matches the ratio was 138-197. In percentage terms, only 40% of the day-night games during this period were won by the team batting second; on the other hand, 57% were won by the team batting first. In 2005, for example, there were only 14 successful run-chases under lights in 49 matches, while in 2001 there were 19 in 59 games. (Click here for the win-loss ratios each year in day-night ODIs since 2000.)
| Match type | ODIs | Won | Lost | Ratio |
| Day | 2087 | 1108 | 933 | 1.18 |
| Day-night | 1121 | 507 | 584 | 0.86 |
| Overall | 3207 | 1615 | 1516 | 1.06 |
| Match type | ODIs | Won | Lost | Ratio |
| Day | 419 | 237 | 175 | 1.35 |
| Day-night | 346 | 138 | 197 | 0.70 |
| Total | 765 | 375 | 372 | 1.01 |
More recently, though, the results are a lot more even in matches played under lights. In fact, since the beginning of 2006, the win-loss stats for the team batting second are 204-202. Since 2009, it's 128-115, suggesting that the balance is slowly shifting.
In day games, on the other hand, the advantage has always been with the team batting second. There are some venues, especially in the subcontinent, where batting first is an advantage - in India, for example, teams batting first have won 21 and lost 15 in 36 day games since January 2006 - but overall, batting second has been the better option. In South Africa, the ratio is favour of the team batting second by as much as 29-13 margin, which means the side chasing wins more than two games for every one it loses. (Click here for the results in each country in day games since 2006.)
| Match type | ODIs | Won | Lost | Ratio |
| Day | 522 | 288 | 223 | 1.29 |
| Day-night | 415 | 204 | 202 | 1.01 |
| Total | 936 | 492 | 424 | 1.16 |
Under lights, though, the country where the results have undergone a huge change is Bangladesh. Between 2000 and 2005, only ten out of 27 day-night matches were won by the side chasing; in the last six years, though, the ratio has turned around completely, to 25 wins and 14 defeats for the team chasing.
In fact, in many of the other host countries too, the ratios have changed significantly. In New Zealand, it has increased by about 45%, in England by 50%, and in Australia by almost 54% (though in Australia teams batting second still lose more than they win). In India, though, the change is pretty insignificant, while in South Africa, the ratio remains almost exactly the same.
| Host country | 2000-2005 - ODIs | Won/ lost | Ratio | 2006- ODIs | Won/ lost | Ratio |
| New Zealand | 36 | 20/ 16 | 1.25 | 31 | 20/ 11 | 1.81 |
| Bangladesh | 27 | 10/ 17 | 0.58 | 39 | 25/ 14 | 1.79 |
| England | 17 | 7/ 8 | 0.87 | 24 | 13/ 10 | 1.30 |
| India | 19 | 10/ 9 | 1.11 | 76 | 40/ 34 | 1.17 |
| Pakistan | 27 | 12/ 15 | 0.80 | 35 | 17/ 18 | 0.94 |
| UAE | 45 | 18/ 27 | 0.67 | 33 | 16/ 17 | 0.94 |
| Australia | 76 | 26/ 48 | 0.54 | 81 | 35/ 42 | 0.83 |
| South Africa | 56 | 21/ 30 | 0.70 | 41 | 17/ 24 | 0.70 |
| Sri Lanka | 43 | 14/ 27 | 0.51 | 46 | 18/ 28 | 0.64 |
And finally, a look at the venues with the best and worst win-loss ratios for the teams batting second. Not surprisingly, the ground which has most favoured the team batting under lights is the Shere Bangla Stadium in Mirpur. Had Bangladesh won the Asia Cup final, the ratio would have been exactly two wins to a defeat for teams chasing under lights in Mirpur. As it is, the ratio is still an impressive 1.75. Among the 12 venues which have hosted ten or more day-night matches during this period, only in four have the teams batting second won more than they've lost.
On the other hand, in eight grounds the teams batting first have had the upper hand. It's most pronounced at the Gaddafi Stadium in Lahore, where the team chasing has a 2-9 win-loss ratio in 11 matches. At Sydney, Brisbane and the Premadasa are three of the other venues where teams batting first still have the advantage. Overall, though, the gap has close considerably.
| Venue | ODIs | Won | Lost | Ratio |
| Shere Bangla, Mirpur | 33 | 21 | 12 | 1.75 |
| MCG | 14 | 8 | 6 | 1.33 |
| Adelaide Oval | 17 | 9 | 7 | 1.28 |
| National Stadium, Karachi | 15 | 7 | 8 | 0.83 |
| WACA, Perth | 11 | 5 | 6 | 0.83 |
| Rangiri Dambulla International Stadium | 16 | 7 | 9 | 0.77 |
| Sheikh Zayed Stadium, Abu Dhabi | 19 | 8 | 11 | 0.72 |
| Gabba, Brisbane | 15 | 5 | 8 | 0.62 |
| R Premadasa Stadium, Colombo | 22 | 8 | 14 | 0.57 |
| SCG | 18 | 6 | 11 | 0.54 |
| Gaddafi Stadium, Lahore | 11 | 2 | 9 | 0.22 |
S Rajesh is stats editor of ESPNcricinfo. Follow him on Twitter