Laxman's golden run
In the last four years he has been a model of consistency. The only slight problem is his stats in the first Test of a series
S Rajesh
15-Jul-2011
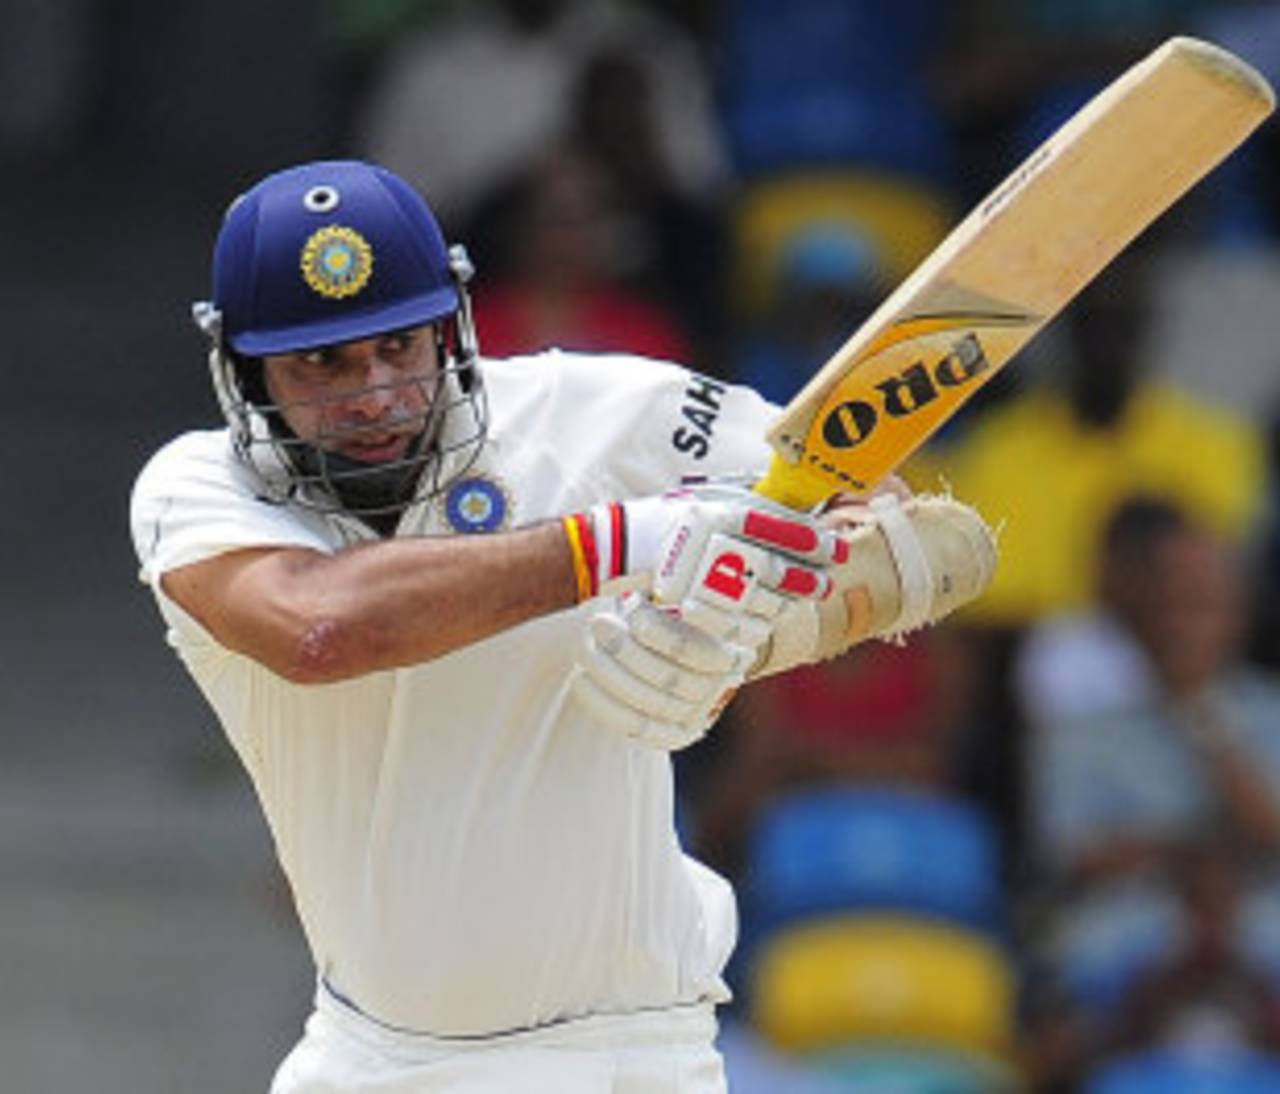
VVS Laxman's second-innings average of 77.83 is easily the best among all batsmen in the last four years • AFP
To say that VVS Laxman is in the form of his life isn't an exaggeration. It's true that his defining innings was played more than a decade ago, but it's also true that in the last four years he has played an abnormally high number of match-saving and match-winning knocks, and consistently held together India's middle and lower order. The grace and style he was born with, but to that he has added consistency and an ability to rise to the occasion, which are far from ordinary. His stats in the last four years, and improvement over the previous years, clearly testify to that.
In the last four years, starting with the tour to England in 2007, Laxman averages 57.33 in 43 Tests, which makes this one of his best extended periods of form in Test cricket - a comparable period was between 2000 and 2003, when he averaged 57.73 in 33 matches, but that was followed by a dip in the next three and a half years, when 31 more Tests fetched only four hundreds, and an average of less than 40. Now, it seems, Laxman is back at his best.
Even here, though, numbers don't tell the complete story. In the last two series that India have played - in South Africa and West Indies - Laxman averaged less than 50, and yet he played key roles in both. In the memorable win in Durban, Laxman's 38 and 96 were the highest scores in each of India's two innings in a match where no other batsman topped 40. In Barbados his 85 and 87 were the two highest scores in the match, and would have almost certainly won India the Test had the weather not intervened. On both occasions the pitches were difficult to bat on, and hardly any other batsmen conquered the conditions; yet Laxman scored runs in all four innings of those matches. In the 13 series that Laxman has played over these last four years (excluding the ones in which he played only one Test), his average dipped below 35 only twice, and below 30 only once. On the other hand, nine times he averaged more than 45.
| Period | Tests | Runs | Average | Strike rate | 100s/ 50s |
| Before 2000 | 16 | 626 | 24.07 | 40.54 | 0/ 5 |
| Jan 2000 to Dec 2003 | 33 | 2656 | 57.73 | 51.86 | 6/ 13 |
| Jan 2004 to Jun 2007 | 31 | 1596 | 37.11 | 47.20 | 4/ 9 |
| July 2007 onwards | 43 | 3268 | 57.33 | 50.48 | 6/ 25 |
| Career | 123 | 8146 | 47.36 | 49.31 | 16/ 52 |
All these runs have made Laxman one of the best batsmen in the world over the last four years. He is one of only nine players to score more than 3000 runs at a 50-plus average during this period. It's also a measure of India's batting strength that they make up three of the top six.
The only aspect where Laxman falls short when compared to others in the list below is in converting fifties into hundreds. Kumar Sangakkara has converted 13 out of 25 fifties, Jacques Kallis 16 out of 26, and Mahela Jayawardene 11 out of 20, but Laxman has only managed six out of 31 scores of 50-plus. Some of that is also because he mostly bats at Nos. 5 or 6, but even at No. 4 he has four fifties and no centuries.
| Batsman | Tests | Runs | Average | Strike rate | 100s/ 50s |
| Kumar Sangakkara | 32 | 3358 | 68.53 | 56.99 | 13/ 12 |
| Jacques Kallis | 38 | 3517 | 63.94 | 52.48 | 16/ 10 |
| Mahela Jayawardene | 33 | 3214 | 61.80 | 52.66 | 11/ 9 |
| Sachin Tendulkar | 40 | 3770 | 61.80 | 54.83 | 14/ 16 |
| Virender Sehwag | 35 | 3539 | 58.98 | 90.55 | 10/ 15 |
| VVS Laxman | 43 | 3268 | 57.33 | 50.48 | 6/ 25 |
| Hashim Amla | 38 | 3281 | 55.61 | 51.88 | 11/ 15 |
| Graeme Smith | 37 | 3172 | 53.76 | 59.88 | 11/ 11 |
| Alastair Cook | 50 | 4085 | 50.43 | 50.23 | 12/ 21 |
A feature of Laxman's batting since almost the beginning of his career has been his tendency to score more runs in the second innings than the first. In his entire career he averages 51.51 in the third and fourth innings of Tests, and is one of only 18 batsmen to score more than 3000 runs in the second innings. In terms of averages he is fifth among those 18 batsmen, and the best for India, marginally ahead of Sunil Gavaskar's 51.46.
However, in the last four years Laxman has taken second-innings batting to another level, with 13 scores of 50-plus in 31 innings, and a stupendous average of 77.83. It's true that the average has been boosted by 13 not-outs, but some of those were very well deserved, as when he made 103 and73 to guide India to victory against Sri Lanka and Australia. In fact, in the last two and a half years the numbers look even better - 867 runs in 14 innings with seven not-outs, at an average of 123.85, with 10 scores of 50-plus.
| Batsman | Innings | Runs | Average | Strike rate | 100s/ 50s |
| VVS Laxman | 31 | 1401 | 77.83 | 49.57 | 2/ 11 |
| Kumar Sangakkara | 23 | 1283 | 64.15 | 54.80 | 6/ 3 |
| Jacques Kallis | 26 | 1213 | 63.84 | 49.42 | 5/ 4 |
| Gautam Gambhir | 22 | 1201 | 63.21 | 49.38 | 5/ 5 |
| Hashim Amla | 27 | 1386 | 63.00 | 49.11 | 5/ 7 |
| Graeme Smith | 26 | 1397 | 58.20 | 59.42 | 5/ 5 |
Compare that second-innings average of 77.83 with his first-innings figure of 47.87 during these last four years, and it's clear that Laxman is a relatively slow starter in a Test match. The stats also show that he's a slow starter in a series - his first-Test stats are much poorer than his overall numbers, which means England will fancy their chances of getting him early at Lord's. His overall average in first Tests of series is less than 37, while in the last four years it has only gone up marginally to 40.40. In his four most recent innings in opening Tests, he has scored a total of 27 runs - 7 and 8 in Centurion, and 12 and 0 in Jamaica. On both occasions he hit back strongly in the second Test, in Durban and Barbados.
The only instance of Laxman scoring a first-Test century was against Zimbabwe in Bulawayo in 2005, when he scored 140.
| Career - Tests | Average | 100s/ 50s | Since Jul 2007 - Tests | Average | 100s/ 50s | |
| 1st Test | 43 | 36.81 | 1/ 15 | 15 | 40.40 | 0/ 7 |
| 2nd Test | 40 | 53.62 | 7/ 17 | 14 | 68.16 | 4/ 7 |
| 3rd Test | 29 | 54.22 | 6/ 14 | 12 | 78.53 | 2/ 9 |
The table below compares the first-Test averages of all of India's top-order batsmen in these last four years. Sachin Tendulkar leads the way, while Virender Sehwag's stats indicate he will be missed at Lord's, especially since Rahul Dravid and Gautam Gambhir haven't shown a tendency of starting series strongly either.
| Batsman | Tests | Runs | Average | 100s/ 50s | Overall ave* |
| Sachin Tendulkar | 15 | 1347 | 58.56 | 6/ 4 | 61.80 |
| Virender Sehwag | 12 | 1266 | 57.54 | 4/ 5 | 58.98 |
| VVS Laxman | 15 | 889 | 40.40 | 0/ 7 | 57.33 |
| Rahul Dravid | 15 | 1085 | 38.75 | 4/ 3 | 40.94 |
| Gautam Gambhir | 11 | 719 | 34.23 | 2/ 3 | 57.95 |
Finally, a break-up of Laxman's numbers against pace and spin over the last nine and a half years. He has always been known to be a strong player of spin, and while that is indicated in his average, it's slightly surprising to see that his scoring rate against spinners is less than three runs per over. As you'd expect, though, his averages against both pace and spin have gone up over the last four years. Against an England attack that has match-winners in both categories, Laxman will need to summon up his best. If he needed any further incentive, here's one: England is the only top team against whom Laxman hasn't scored a hundred, and the only ones against whom he averages less than 35.
| Jan 2002-Jun 2007 - dismissals | Average | Run-rate | July 2007 onwards - dismissals | Average | Run-rate | |
| Pace | 44 | 46.79 | 2.82 | 32 | 54.03 | 3.20 |
| Spin | 21 | 51.09 | 2.73 | 22 | 65.13 | 2.83 |
S Rajesh is stats editor of Cricinfo