Chennai's dominance, lack of huge scores and the role of spin
A stats review of IPL 2011, and how it compares with previous editions
Madhusudhan Ramakrishnan
30-May-2011
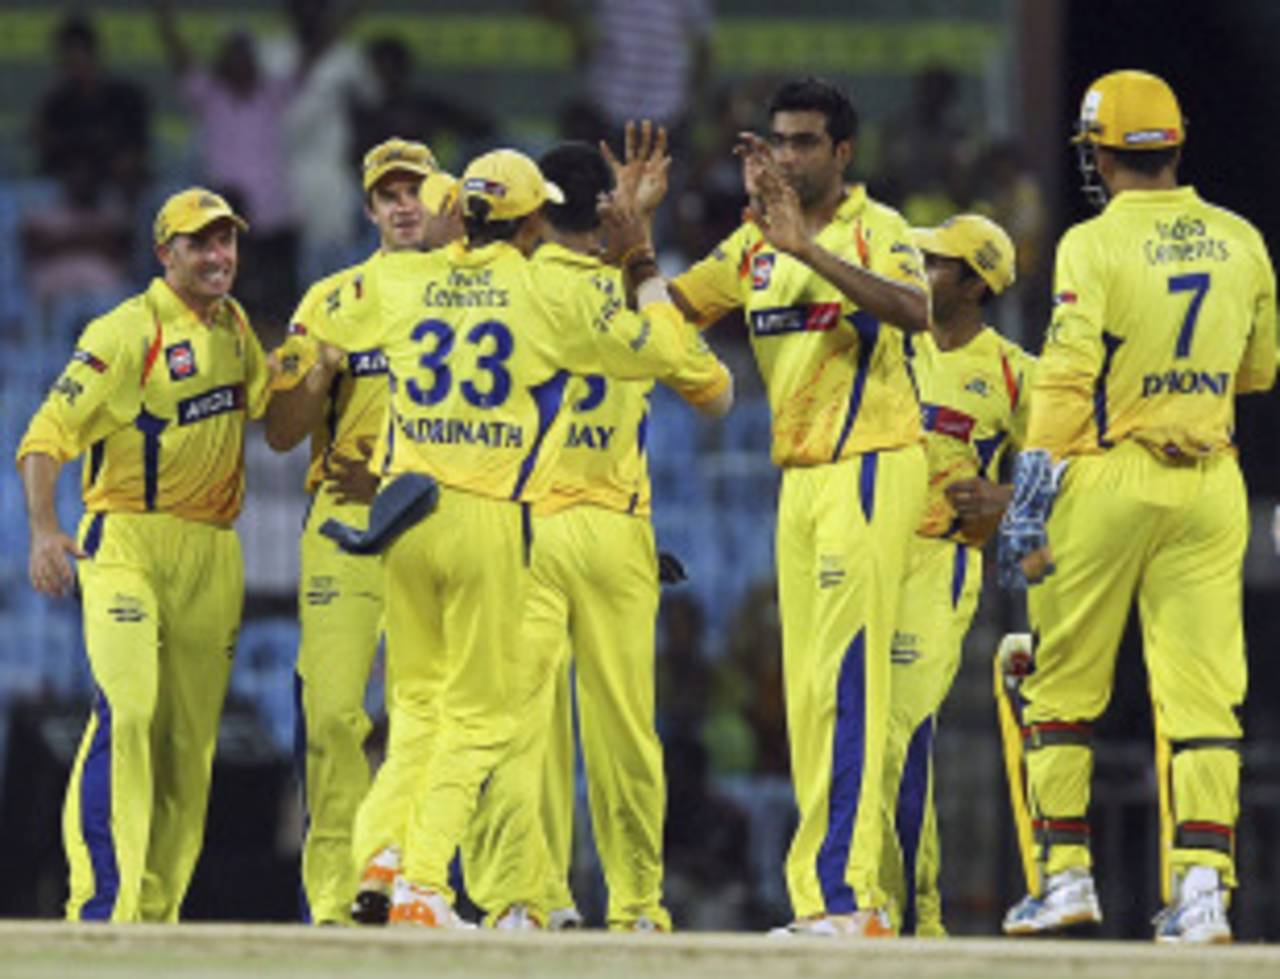
Chennai have been remarkably consistent not just in IPL 2011, but across all four seasons • Associated Press
Chennai: unparalleled consistency across seasons
While most teams have struggled for consistency through a single season, Chennai have not only been dominant from start to finish of one tournament, but have also been exceptional across all four editions of the IPL. They lost a close final in the inaugural season to Rajasthan and made the semi-final the following year where they lost to Bangalore. In 2010, they beat fancied Mumbai Indians in the final before going on to lift the Champions League later in the year.
While most teams have struggled for consistency through a single season, Chennai have not only been dominant from start to finish of one tournament, but have also been exceptional across all four editions of the IPL. They lost a close final in the inaugural season to Rajasthan and made the semi-final the following year where they lost to Bangalore. In 2010, they beat fancied Mumbai Indians in the final before going on to lift the Champions League later in the year.
Aided by a perfect home record this year, Chennai won two consecutive games in the knockout stage against Bangalore, who had been the form team of the IPL going into the final week. Chennai's approach was much more conservative at the start of the innings when compared to most other teams, but their strategy of retaining wickets for the late overs proved to be a masterstroke. The powerful middle order ensured that Chennai scored a remarkably high number of boundaries in the end overs. They scored nearly 58% of their runs in the last six overs in boundaries (544 out of 939) at a run-rate of 10.33. On the bowling front too, Chennai were superb. They conceded less than eight runs per over overall and managed to stay quite economical in the last six-over period too (economy-rate 8.58).
Chennai's win-loss ratio of 2.20 in IPL 2011 was comfortably the best among the top four teams. Bangalore and Mumbai finished with 10 wins and six losses while Kolkata were third, with eight wins and seven losses. Chennai preferred batting first and won eight times when they did. They did, however, chase down a highly competitive target in the vital qualifier game against Bangalore which ensured that they would not need to play the second qualifier before the final. Overall, across the four seasons, Chennai have a win-loss ratio of 1.54 which is better than that of Mumbai (1.26) and Bangalore (1.00). Although Mumbai have been the better bowling side with a better economy-rate and average, Chennai's all-round strength has proved to be crucial to their consistency across all seasons.
| Team | W/L ratio (2011) | Wins(bat first/chasing) -2011 | Bat avg/Bowl avg (2011) | RR/ER (2011) | W/L ratio- overall | Wins(bat first/chasing)- overall | Bat avg/Bowl avg- overall | RR/ER- overall |
| Chennai | 2.20 | 8/3 | 34.59/25.27 | 8.13/7.62 | 1.54 | 23/14 | 30.85/24.87 | 8.25/7.89 |
| Bangalore | 1.66 | 3/7 | 31.25/28.87 | 8.39/8.07 | 1.00 | 9/22 | 24.22/28.57 | 7.83/7.97 |
| Mumbai | 1.66 | 5/5 | 27.90/22.16 | 7.44/7.48 | 1.26 | 19/14 | 26.17/22.68 | 7.96/7.65 |
| Kolkata | 1.14 | 3/5 | 28.49/23.54 | 7.51/7.26 | 0.80 | 11/13 | 26.04/27.37 | 7.60/7.82 |
A balanced edition in most aspects
The average runs per wicket in IPL 2011 was very similar to that of the previous IPL tournaments that were played in India (2008 and 2010). However the run-rate (7.72) was slightly lower than the figures for those seasons (8.30 and 8.12). The 2009 IPL, which was played in South Africa, has been the most bowler-friendly edition with the lowest average and run-rate among the four seasons. In the early part of IPL 2011, chasing had proved to be the better option and nearly every team except Chennai employed the strategy. Overall, teams won 40 games chasing and 32 batting first. The ratio of wins chasing to wins batting first is lower only than the first season when teams won 36 times while chasing and 22 while batting first.
The average runs per wicket in IPL 2011 was very similar to that of the previous IPL tournaments that were played in India (2008 and 2010). However the run-rate (7.72) was slightly lower than the figures for those seasons (8.30 and 8.12). The 2009 IPL, which was played in South Africa, has been the most bowler-friendly edition with the lowest average and run-rate among the four seasons. In the early part of IPL 2011, chasing had proved to be the better option and nearly every team except Chennai employed the strategy. Overall, teams won 40 games chasing and 32 batting first. The ratio of wins chasing to wins batting first is lower only than the first season when teams won 36 times while chasing and 22 while batting first.
Despite the fact that a huge number of fours and sixes were hit, the boundary-run percentage in IPL 2011 has also been surprisingly low. The figure of 54.29% is slightly lower than IPL 2010 with only the low-scoring IPL 2009 ranking lower (50.85). IPL 2011 also witnessed the most centuries (6) and the most fifties (89). Overall, though, the number of fifties per match (1.28) was lower than IPL 2008 (1.534) and IPL 2010 (1.533) and higher than IPL 2009 (1.22).
Another notable feature of IPL 2011 was the lack of huge team scores. There were 14 scores of 180 or more which is lower than IPL 2010 ( 21) and IPL 2008 (16). On the other hand, there were nine scores less than or equal to 120 (20 overs played), which was the highest number of such scores across all four seasons. While IPL 2009 had eight such scores, IPL 2008 and IPL 2010 had just three and one such score respectively.
| Season | Matches | Wins(bat first/chasing) | Average | Run-rate | Boundary% | 100/50 |
| 2008 | 58 | 22/36 | 26.03 | 8.30 | 58.76 | 6/83 |
| 2009 | 57 | 26/30 | 23.41 | 7.48 | 50.85 | 2/68 |
| 2010 | 60 | 31/28 | 26.20 | 8.12 | 54.84 | 4/88 |
| 2011 | 74 | 32/40 | 26.01 | 7.72 | 54.29 | 6/89 |
Conservative start and strong finish
The table below shows the performance of teams across different phases of the innings while batting first and chasing. The lower run-rate in the first six-over period in IPL 2011 clearly indicates a slightly more conservative approach. Apart from Bangalore, who had Chris Gayle in stunning form through the latter half of the tournament, no other team managed to dictate terms in the beginning of the innings consistently. In the middle-over period, the scoring rate has been lower than IPL 2008 and IPL 2010, but the average is much higher which points to the strategy of preserving wickets to help in accelerating in the end overs. In IPL 2011, chasing teams found the going better at the start of the innings, but did not manage to do as well in the middle and end of an innings. The run-rate in the end overs of the second innings (8.67) is second only to IPL 2008 (9.22), a season in which chasing teams have had the best record.
The table below shows the performance of teams across different phases of the innings while batting first and chasing. The lower run-rate in the first six-over period in IPL 2011 clearly indicates a slightly more conservative approach. Apart from Bangalore, who had Chris Gayle in stunning form through the latter half of the tournament, no other team managed to dictate terms in the beginning of the innings consistently. In the middle-over period, the scoring rate has been lower than IPL 2008 and IPL 2010, but the average is much higher which points to the strategy of preserving wickets to help in accelerating in the end overs. In IPL 2011, chasing teams found the going better at the start of the innings, but did not manage to do as well in the middle and end of an innings. The run-rate in the end overs of the second innings (8.67) is second only to IPL 2008 (9.22), a season in which chasing teams have had the best record.
| Season | 1-6(1st inns) | 7-14(1st inns) | 15-20(1st inns) | 1-6(2nd inns) | 7-14(2nd inns) | 15-20(2nd inns) |
| 2008 | 7.47, 29.91 | 7.46, 26.87 | 10.14, 18.50 | 7.92, 30.95 | 8.29, 38.11 | 9.22, 19.64 |
| 2009 | 7.33, 26.14 | 6.60, 28.57 | 9.16, 18.29 | 7.10, 26.62 | 6.83, 26.32 | 8.60, 18.73 |
| 2010 | 7.83, 28.48 | 7.41, 30.68 | 9.79, 23.07 | 7.95, 37.16 | 7.68, 26.50 | 8.54, 17.81 |
| 2011 | 6.98, 29.67 | 7.32, 35.36 | 9.28, 18.64 | 7.42, 29.97 | 7.28, 29.32 | 8.67, 19.76 |
Gayle's incredible numbers
Not only did Gayle make a mockery of the previous record for the most sixes hit in a season, he also ended up scoring more than 600 runs in 12 innings with two centuries and three fifties. In the matches he played, Gayle scored nearly 33% of the total team runs, and is on top of the list of batsmen with the highest percentage of team runs in IPL 2011 (top run getters for each team only). Virender Sehwag scored 24.48% of the runs for Delhi before an injury ended his run in the tournament. The eventual champions Chennai had many contributors, with Michael Hussey leading the way with 22.17% of the team runs. Shaun Marsh, who topped the runs tally for Punjab in IPL 2011 with 504 runs, scored 35.26% of the team runs in IPL 2008. Matthew Hayden and Sachin Tendulkar had the highest percentage of team runs in IPL 2009 and IPL 2010 with figures of 29.68% and 23.72% respectively.
Not only did Gayle make a mockery of the previous record for the most sixes hit in a season, he also ended up scoring more than 600 runs in 12 innings with two centuries and three fifties. In the matches he played, Gayle scored nearly 33% of the total team runs, and is on top of the list of batsmen with the highest percentage of team runs in IPL 2011 (top run getters for each team only). Virender Sehwag scored 24.48% of the runs for Delhi before an injury ended his run in the tournament. The eventual champions Chennai had many contributors, with Michael Hussey leading the way with 22.17% of the team runs. Shaun Marsh, who topped the runs tally for Punjab in IPL 2011 with 504 runs, scored 35.26% of the team runs in IPL 2008. Matthew Hayden and Sachin Tendulkar had the highest percentage of team runs in IPL 2009 and IPL 2010 with figures of 29.68% and 23.72% respectively.
| Batsman | Team | Team runs* | Batsman runs | % of team runs |
| Chris Gayle | Bangalore | 1863 | 608 | 32.64 |
| Michael Hussey | Chennai | 2219 | 492 | 22.17 |
| Sachin Tendulkar | Mumbai | 2288 | 553 | 24.17 |
| Jacques Kallis | Kolkata | 2023 | 424 | 20.96 |
| Shaun Marsh | Punjab | 2224 | 504 | 22.66 |
| Brendon McCullum | Kochi | 1792 | 357 | 19.92 |
| Rahul Dravid | Rajasthan | 1687 | 343 | 20.33 |
| Shikhar Dhawan | Deccan | 2140 | 400 | 18.69 |
| Virender Sehwag | Delhi | 1732 | 424 | 24.48 |
| Yuvraj Singh | Pune | 1775 | 343 | 19.32 |
Middle-order batsmen shine
While the top six wickets in IPL 2008 and IPL 2010 scored at nearly eight runs per over throughout, the same was not true in the just-concluded edition. The top order scored slower than in previous seasons (with the exception of 2009), but maintained a good average. The first three wickets did, however, post more fifty-plus partnerships than they did in the previous years. The middle order had a much higher scoring-rate than the top order in IPL 2011, but the rate was still much lower than the two previous IPL seasons played in India.
While the top six wickets in IPL 2008 and IPL 2010 scored at nearly eight runs per over throughout, the same was not true in the just-concluded edition. The top order scored slower than in previous seasons (with the exception of 2009), but maintained a good average. The first three wickets did, however, post more fifty-plus partnerships than they did in the previous years. The middle order had a much higher scoring-rate than the top order in IPL 2011, but the rate was still much lower than the two previous IPL seasons played in India.
| Season | 1st wkt | 2nd wkt | 3rd wkt | 4th wkt | 5th wkt | 6th wkt |
| 2008 | 8.04, 32.41, 25 | 8.58, 32.85, 23 | 8.01, 29.15, 18 | 8.28, 28.61, 18 | 8.15, 24.04, 8 | 8.70, 20.03, 3 |
| 2009 | 7.52, 24.00, 21 | 7.24, 22.97, 15 | 7.25, 32.17, 25 | 7.64, 30.69, 18 | 7.99, 27.36, 14 | 7.61, 15.07, 1 |
| 2010 | 7.97, 30.54, 24 | 8.35, 31.93, 24 | 8.23, 28.70, 23 | 8.07, 29.12, 17 | 8.32, 31.46, 15 | 8.36, 18.62, 2 |
| 2011 | 7.97, 32.51, 34 | 7.63, 32.25, 31 | 7.29, 28.66, 21 | 7.73, 25.31, 18 | 8.03, 27.93, 10 | 8.14, 18.10, 1 |
Spinners prove vital
While the role of pace bowlers has remained quite similar across all four seasons, the same is not true of the spinners. Spinners came to the fore in IPL 2009 in South Africa and were highly responsible for curtailing the scoring-rate in the middle of the innings. In 2011, fast bowlers averaged just over 28 at an economy-rate of 7.80 which made it their most successful year after IPL 2009, when they averaged just over 26 at an economy-rate of 7.65.
While the role of pace bowlers has remained quite similar across all four seasons, the same is not true of the spinners. Spinners came to the fore in IPL 2009 in South Africa and were highly responsible for curtailing the scoring-rate in the middle of the innings. In 2011, fast bowlers averaged just over 28 at an economy-rate of 7.80 which made it their most successful year after IPL 2009, when they averaged just over 26 at an economy-rate of 7.65.
Rahul Sharma was the standout spinner in IPL 2011 with 16 wickets at a superb economy-rate of 5.46. Daniel Vettori, Shane Warne and R Ashwin also returned excellent figures throughout a season in which spinners had a tremendous impact. Ashwin was consistently employed by MS Dhoni in the first six-over period and proved his worth in the final when he dismissed the dangerous Gayle in the first over of the innings. Overall, the average and economy-rate for spinners in IPL 2011 were bettered only by the corresponding figures in IPL 2009.
| Season | Matches | Pace | Spin |
| 2008 | 58 | 445, 29.23, 8.09 | 134, 30.38, 8.19 |
| 2009 | 57 | 388, 26.25, 7.65 | 226, 24.77. 6.76 |
| 2010 | 60 | 405, 29.64, 8.32 | 210, 28.80, 7.34 |
| 2011 | 74 | 470, 28.12, 7.80 | 267, 27.66, 7.12 |