Wade-Short show the bright spot for BBL batting
The Hobart Hurricanes openers, and Marcus Stoinis, stood out for their efforts in a season that has otherwise been low-key for batsmen
Bharath Seervi
Feb 11, 2019, 1:05 PM
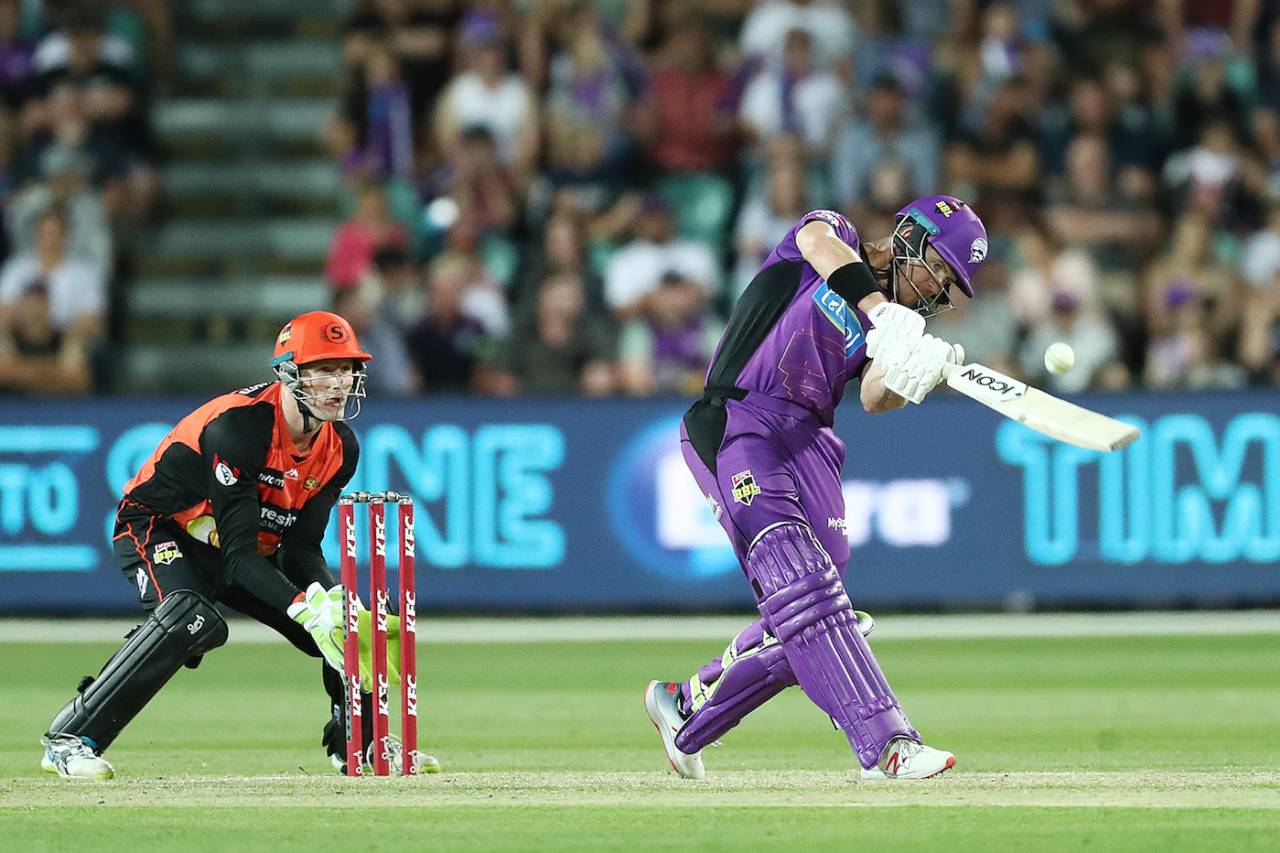
Cricket Australia/Getty Images
602- Runs for the Hobart Hurricanes batsman D'Arcy Short in this year's edition - the most by a batsman in a BBL season. He beat his own record of 572 runs made last season. His opening partner, Matthew Wade, finished just below Short, with 590 runs. Both Short and Wade hit six fifties each in the 14 matches of the group stage and hit 20 and 21 sixes respectively.
7.81 Run rate in this season's BBL, the second-lowest of eight seasons so far. The only edition that had a lower scoring rate was 2012-13, when it was 7.66. The run rate in the middle-overs this season has been 7.43, which is the lowest in all seasons.
0- Number of 200-plus totals in this season. The highest total was 196 for 3 by the Hurricanes in their chase against the Sydney Thunder. The only BBL edition without a single 200-plus total before this was in 2012-13. Incidentally, the Big Bash League 2018-19 is the only T20 tournament so far which has had 50-plus matches without any 200-plus total, out of 39 such tournaments across the world.
810- Runs accumulated by the Hurricanes' opening pair, Short and Wade, in 14 innings so far. This is already the second-best by any pair in any T20 series or tournament (minimum 13 innings). The only pair with a higher aggregate is Virat Kohli and AB de Villiers who had added 939 runs in 13 innings in the Indian Premier League 2016. The previous best by a pair in the BBL was 410 runs by Joe Burns and Luke Pomersbach in eight innings in the 2012-13 edition. Short and Wade average 56.86 as a pair in T20s, the third-best among all opening pairs with a minimum of 10 innings.
40.07- Average runs per wicket for the Hurricanes this season - the best for a team in a BBL season by a distance. The previous best in a BBL season was 32.67 by the Melbourne Renegades in 2017-18. The Hurricanes' average is second only to Royal Challengers Bangalore's 41.98 in IPL 2016 among teams playing 10-plus games in a tournament. Hurricanes were never all out in any of the 14 games of the league stage, and the most wickets they lost in any match were seven.
8 Position at which the Perth Scorchers finished, easily their poorest BBL season. They have been the most successful side in the tournament's history, qualifying for the semi-finals in each of the first seven editions, playing the final five times, and winning the title on three occasions.
45.43- Difference in batting and bowling averages of Marcus Stoinis - the third-best for any player who has scored 250-plus runs and taken 10-plus wickets in a T20 tournament. Stoinis, who plays for the Melbourne Stars, has made 476 runs at 59.50 and taken 14 wickets at 14.07 in 11 matches so far. On five successive occasions this season, Stoinis scored 30 or more and took two or more wickets in the same match. His batting average of 59.50 is also the best among all batsmen in a single BBL season (minimum 10 innings). Short, too, has a difference of 26.92 in his batting and bowling averages this season, having picked up 10 wickets at 27.80 alongside his batting exploits (average of 54.72).
24 Wickets for Kane Richardson this season, already the most by a bowler in a BBL season. He has those scalps in 12 games at an average of 14.91, including five three-wicket hauls. He has picked 14 of those wickets in five matches at the Docklands Stadium in Melbourne, at an average of just 9.07.
3.12- Mujeeb Ur Rahman's Smart Economy Rate* this season - the best among all bowlers who delivered 10-plus overs. Chris Green, Jason Behrendorff, Usman Shinwari and Harry Gurney complete the top-5 list. Among batsmen, Josh Philippe had the best Smart Strike Rate, of 198.82, given a minimum of 100 balls faced. Ben Cutting, George Bailey, Glenn Maxwell and Tom Curran are the others in the top-5.
| Bowler | Inns | Wkts | Economy | Smart Economy | Runs saved |
| Mujeeb Ur Rahman | 12 | 12 | 6.04 | 3.12 | 136 |
| Chris Green | 13 | 8 | 6.89 | 3.84 | 113 |
| Usman Shinwari | 7 | 8 | 6.14 | 3.94 | 62 |
| Jason Behrendorff | 11 | 9 | 6.24 | 3.96 | 92 |
| Harry Gurney | 7 | 8 | 7.23 | 5.20 | 53 |
| Batsman | Inns | Runs | SR | Smart SR |
| Josh Philippe | 9 | 252 | 156.52 | 198.82 |
| Ben Cutting | 13 | 249 | 153.69 | 185.89 |
| George Bailey | 11 | 326 | 153.05 | 177.79 |
| Glenn Maxwell | 10 | 287 | 147.93 | 177.07 |
| Tom Curran | 9 | 185 | 144.53 | 174.36 |
Bharath Seervi is stats sub-editor at ESPNcricinfo @SeerviBharath