The T20 explosion, India's dominance, and Kohli's ODI gluttony
We study the stats of the decade and find that everyone is playing a lot of T20, no team is as imposing as Australia were in the 2000s, and that Malinga and Kohli were unstoppable
S Rajesh
Jan 3, 2020, 1:48 AM
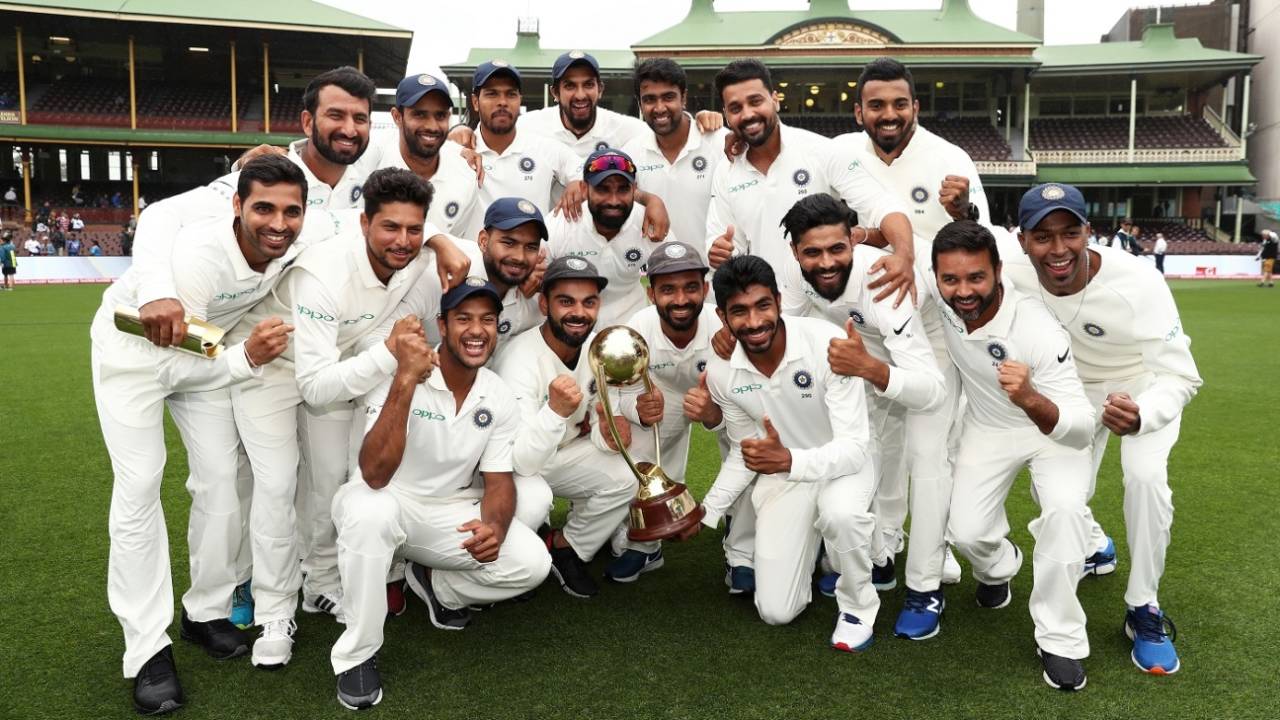
India were the top team of the decade with a win-loss ratio over 1.88 in each format • David Gray/AFP/Getty Images
The 2010s saw the emergence of a new world order in cricket. While the 20-over format was introduced in the 2000s, it was in the decade just gone by that it really made its presence felt, with the proliferation of leagues and domestic tournaments. As many as 7177 T20s - both international and leagues/domestic - were played in this decade, which is a five-fold increase over the corresponding number for the 2000s (1435). In terms of T20Is, the rise was even steeper: from 127 matches in the 2000s to 897 in the last decade.
With 20-over matches invading the cricket calendar, it was obvious that other formats would have to make way to accommodate these games. The numbers show that is exactly what happened. For the first time since the 1940s, the number of Tests played in a decade decreased compared to the previous decade. It was also the first such decrease in ODI history, since the format started in 1971. Australia, India and Pakistan all played about 20% fewer ODIs this decade than they did in the 2000s.
In terms of playing days for the players, not a whole lot has changed in the last 15 years. ESPNcricinfo has complete data for actual playing days of first-class, List A and T20 matches from the beginning of 2006. Comparing the playing days of some of the top players from the last four years of the previous decade (2006-09) with the last four years of the current decade (2016-19), it is clear that the workloads - in terms of actual days of cricket - has not changed significantly from the previous decade. The table below is a representative list of playing days for some of the players in the last two decades; it includes a mix of players who were active on various domestic circuits and international stars.
What did change, though, was the number of T20 matches in the two periods. Between 2006 and 2009, Albie Morkel played 79 T20s, the most of any player; between 2016 and 2019, that figure went up to 197 (Kieron Pollard). In that period, Rashid Khan played 196, and a total of 11 players played more than 150 T20s.
The dominant team of the decade
No team dominated the 2010s like Australia did the previous decade. In the 2000s they had a 79-18 win-loss record in Tests, for a ratio of 4.39; in ODIs, their win-loss ratio was 3.06 (202 wins, 66 losses), and they also won both 50-over World Cups in the decade. No other major team touched a win-loss ratio of 1.9 in either format in the 2000s.
No team dominated the 2010s like Australia did the previous decade. In the 2000s they had a 79-18 win-loss record in Tests, for a ratio of 4.39; in ODIs, their win-loss ratio was 3.06 (202 wins, 66 losses), and they also won both 50-over World Cups in the decade. No other major team touched a win-loss ratio of 1.9 in either format in the 2000s.
In the 2010s, the spoils were divided more evenly. In Tests, four teams had win-loss ratios of more than 1.2, while in ODIs four teams managed 1.5 or more (with a cut-off of 150 matches in the decade). And though no team touched a ratio of 2.0, India came closest to that mark in both formats, making them the top team of the decade.
In Tests, India won 56 and lost 29 (ratio 1.93), easily their best numbers for a decade; in ODIs, they nearly managed two wins per defeat, winning 157 and losing 79 (1.99); and in T20Is too they were the best among the top sides, with a 68-36 record.
Despite their recent slump, South Africa were second-best across formats; their 45-25 Test record indicated just how good they used to be: in the first four years of the decade, they won 19 Tests and lost only five. In ODIs, their win-loss ratio of 1.68 was again second to India's, while Australia (1.58) and England (1.50) took the next two spots.
The more things change...
Amid all the changes in cricket, the one seemingly immoveable object is the average runs-per-wicket figure in Tests. In the 2010s teams averaged 32.65 runs per wicket, which was hardly different from the average in the 1980s (32.64), 1970s (32.80), 1960s (32.27), or even 1930s (32.69). In fact, over the entire history of Test cricket that average is 32.07, which shows how the contest between bat and ball in the longest form has essentially maintained equilibrium over all these years despite small periods when that balance seemed to go askew.
Amid all the changes in cricket, the one seemingly immoveable object is the average runs-per-wicket figure in Tests. In the 2010s teams averaged 32.65 runs per wicket, which was hardly different from the average in the 1980s (32.64), 1970s (32.80), 1960s (32.27), or even 1930s (32.69). In fact, over the entire history of Test cricket that average is 32.07, which shows how the contest between bat and ball in the longest form has essentially maintained equilibrium over all these years despite small periods when that balance seemed to go askew.
Compared to the previous decade, the average dropped around 4%, from 34.17 to 32.65. That was largely because of the numbers in the second half of the decade: between 2010 and 2014, the average was 34.20; in the last five years, it fell to 31.25, a drop of almost 9%. The scoring rate shot up in the previous decade - it was 3.20 per over in the 2000s, compared with 2.86 in the 1990s - but it remained similar in the 2010s, at 3.22.
Result-oriented Tests, and ODI run rates on the rise
The runs-per-wicket figure has remained similar over several decades, but with the scoring rates rising, there been a steady decrease in the number of draws. In the 2010s, a whopping 80.6% of Tests ended decisively (349 out of 433), the highest win percentage ever in a decade, going past the 75.4% mark of the 2000s.
The runs-per-wicket figure has remained similar over several decades, but with the scoring rates rising, there been a steady decrease in the number of draws. In the 2010s, a whopping 80.6% of Tests ended decisively (349 out of 433), the highest win percentage ever in a decade, going past the 75.4% mark of the 2000s.
Even within the decade, there is a clear difference between the first half and the second half. In the first six years (2010 to 2015), the result percentage was 75.8, which was similar to the 2000s. In the last four years (2016 to 2019), that percentage jumped to 87.3, with only 23 draws in 181 Tests.
The ODI batting average increased slightly from 30 in the 2000s to 31.45 this decade, but the run rate climbed over 5 for the first time in any decade; in fact, from 2011 onwards, the rate in each calendar year was more than 5, with the highest being 5.5 in 2015, when the World Cup produced some really high totals. Since then the rates have tapered off a bit, but still, the last five years averaged 5.38 compared to 5.09 in the first half of the decade.
The top performers in Tests
With an aggregate of 8818 runs, Alastair Cook topped the aggregates chart in Tests in the 2010s, but that was also because of the sheer number of matches he played. Cook batted 201 times in Tests, the highest for any batsman in any decade. In terms of averages, though, he ranked only 14th among the 21 batsmen who scored 4000-plus runs in the decade.
With an aggregate of 8818 runs, Alastair Cook topped the aggregates chart in Tests in the 2010s, but that was also because of the sheer number of matches he played. Cook batted 201 times in Tests, the highest for any batsman in any decade. In terms of averages, though, he ranked only 14th among the 21 batsmen who scored 4000-plus runs in the decade.
Leading the averages list was the prolific Steven Smith, who scored 26 centuries in 130 innings. He was one of two batsmen to average more than 60 in the decade - the other was Kumar Sangakkara. Virat Kohli scored one century more than Smith, but in 11 more innings.
Among the bowlers, James Anderson was the leading wicket-taker of the decade with 429 Test wickets at an average of 24.35. Among the 26 bowlers who took 150 or more Tests wickets in the 2010s, three South Africans had a better average - Vernon Philander, Dale Steyn and Kagiso Rabada.
Kohli raises the ODI bar
Kohli achieved in the 2010s what no other batsman had in any previous decade in internationals. He scored 11,125 runs in ODIs, which was the first instance of any batsman scoring over 10,000 runs in a single format in any decade. In ODIs alone, his aggregate is 2000 runs clear of the next best - Ricky Ponting's 9103 runs in the 2000s. Kohli's 42 ODI hundreds are also the best in any decade (the next best is 28 by Rohit Sharma this decade), as are his 69 international hundreds across formats (next best: Ponting's 55 in the 2000s). Kohli won 35 Man-of-the-Match awards in ODIs this decade, which equals Sachin Tendulkar's record from the 1990s; Tendulkar played 228 matches in that decade to Kohli's 227 in the 2010s.
Kohli achieved in the 2010s what no other batsman had in any previous decade in internationals. He scored 11,125 runs in ODIs, which was the first instance of any batsman scoring over 10,000 runs in a single format in any decade. In ODIs alone, his aggregate is 2000 runs clear of the next best - Ricky Ponting's 9103 runs in the 2000s. Kohli's 42 ODI hundreds are also the best in any decade (the next best is 28 by Rohit Sharma this decade), as are his 69 international hundreds across formats (next best: Ponting's 55 in the 2000s). Kohli won 35 Man-of-the-Match awards in ODIs this decade, which equals Sachin Tendulkar's record from the 1990s; Tendulkar played 228 matches in that decade to Kohli's 227 in the 2010s.
It is not as if Kohli played more games to achieve that phenomenal ODI aggregate of 11,125. Among the top six batsmen in the table below, four played more innings than Kohli. In all, 24 batsmen scored 4000 or more ODI runs in the decade, but only one, AB de Villiers, had a higher average than Kohli's 60.79.
Malinga towers over the rest
Among the bowlers, Lasith Malinga took a whopping 40% more ODI wickets than the next highest in the decade. He had 248 wickets and Shakib Al Hasan came in next with 177. Overall, the top wicket-takers had relatively meagre returns this decade. Only one bowler took more than 200 wickets, compared to 12 in the previous decade.
Among the bowlers, Lasith Malinga took a whopping 40% more ODI wickets than the next highest in the decade. He had 248 wickets and Shakib Al Hasan came in next with 177. Overall, the top wicket-takers had relatively meagre returns this decade. Only one bowler took more than 200 wickets, compared to 12 in the previous decade.
The T20 stars
The top performers in the 20-over format were a mix of players who specialise in the format and those who have proven themselves in the longer formats as well. The list of top ten run scorers in T20s included Kohli, David Warner, Chris Gayle and de Villiers, along with Pollard, Shoaib Malik and Suresh Raina. Gayle had his moments in the other formats as well this decade, scoring 333 in a Test and 215 in an ODI, but mostly he was a T20 specialist. He played for 22 different teams in these ten years and scored 21 hundreds. No other batsman scored more than eight T20 hundreds in this period.
The top performers in the 20-over format were a mix of players who specialise in the format and those who have proven themselves in the longer formats as well. The list of top ten run scorers in T20s included Kohli, David Warner, Chris Gayle and de Villiers, along with Pollard, Shoaib Malik and Suresh Raina. Gayle had his moments in the other formats as well this decade, scoring 333 in a Test and 215 in an ODI, but mostly he was a T20 specialist. He played for 22 different teams in these ten years and scored 21 hundreds. No other batsman scored more than eight T20 hundreds in this period.
The list of highest wicket-takers featured more specialists, with Sunil Narine, Dwayne Bravo, Rashid Khan, Andre Russell and Sohail Tanvir among the top ten.
| Player | Inns | Runs | Ave | SR | 100s |
| Chris Gayle | 363 | 12289 | 38.40 | 148.27 | 21 |
| Kieron Pollard | 427 | 9493 | 31.02 | 149.51 | 1 |
| Aaron Finch | 268 | 8546 | 36.05 | 144.35 | 7 |
| Brendon McCullum | 297 | 8135 | 30.01 | 136.10 | 6 |
| Virat Kohli | 226 | 8070 | 44.58 | 135.92 | 5 |
| David Warner | 239 | 8018 | 39.11 | 141.98 | 8 |
| Shoaib Malik | 294 | 7942 | 37.28 | 125.64 | 0 |
| Suresh Raina | 265 | 7388 | 32.98 | 138.09 | 4 |
| Shane Watson | 279 | 7364 | 28.99 | 137.72 | 6 |
| AB de Villiers | 236 | 7241 | 38.51 | 153.50 | 3 |
| Player | Mat | Wkts | Ave | Econ |
| Dwayne Bravo | 403 | 440 | 24.82 | 8.25 |
| Sunil Narine | 336 | 379 | 20.36 | 6.02 |
| Shakib Al Hasan | 297 | 341 | 21.10 | 6.90 |
| Imran Tahir | 262 | 335 | 19.68 | 7.06 |
| Lasith Malinga | 244 | 335 | 19.26 | 7.05 |
| Sohail Tanvir | 281 | 293 | 25.17 | 7.34 |
| Andre Russell | 314 | 287 | 25.56 | 8.27 |
| Rashid Khan | 198 | 279 | 17.06 | 6.28 |
| Wahab Riaz | 226 | 272 | 21.04 | 7.11 |
| Shahid Afridi | 256 | 266 | 23.44 | 6.82 |
More in the decade in review, 2010-19
S Rajesh is stats editor of ESPNcricinfo. @rajeshstats