Spin kings v batting superpowers
A look at some of the key numbers ahead of the England-New Zealand semi-final
S Rajesh
Mar 29, 2016, 12:04 PM
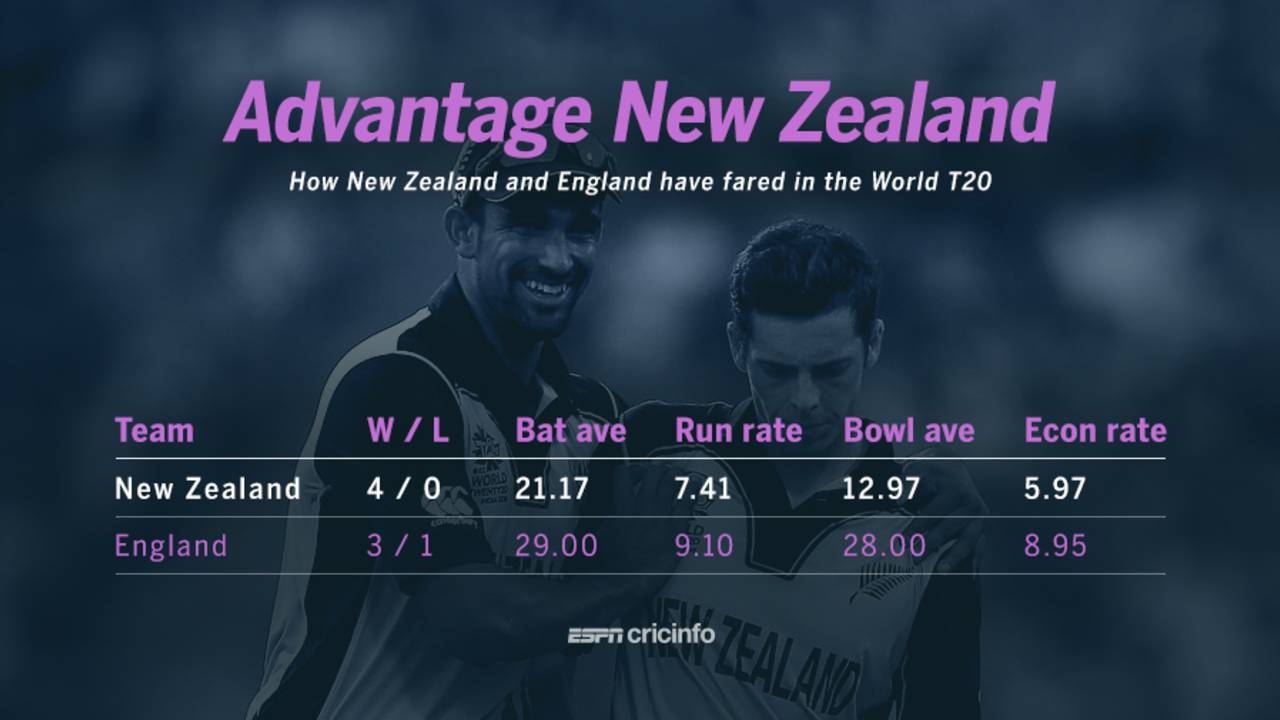
England have the highest run rate among all teams in the Super 10s, but New Zealand have the best bowling average and economy rate • ESPNcricinfo Ltd
8-4 England's win-loss record in T20Is versus New Zealand. Between 2008 and 2013, they won six in a row, the most consecutive by one of the top eight teams against another in T20Is. (India equalled this record with their sixth successive win against Australia on Sunday.) Eight is the second-most wins for England, and the second-most losses for New Zealand, against any opposition in T20Is.
4 Number of different venues where New Zealand have played their matches in this World T20 - Nagpur, Dharamsala, Mohali and Kolkata. The semi-final in Delhi will be their fifth venue. England, on the other hand, have only played in Mumbai and Delhi. The semi-final will be their third game at the Feroz Shah Kotla: they have earlier beaten Afghanistan and Sri Lanka here.
5.97 The economy rate for New Zealand's bowlers in the tournament, the best among all teams in the Super 10s; the next best is West Indies at 6.86. New Zealand's bowling average of 12.97 runs per wicket is also the best, well clear of West Indies' 18.30. England's run rate of 9.10 is the best among all teams, but their economy rate of 8.95 is also the worst. For New Zealand, the difference between their run rate and economy rate is 1.44; for England it's only 0.15.
| Team | W/ L | Bat ave | Run rate | Bowl ave | Econ rate | RR-ER |
| New Zealand | 4/ 0 | 21.17 | 7.41 | 12.97 | 5.97 | 1.44 |
| England | 3/ 1 | 29.00 | 9.10 | 28.00 | 8.95 | 0.15 |
20 Wickets for New Zealand's spinners, the most by any team in the Super 10 stage of this tournament. Afghanistan are next with 15, followed by India on 12. Mitchell Santner has taken 9 for 86 in 15 overs, Ish Sodhi 8 for 78 in 15.4 and Nathan McCullum 3 for 21 in five. Santner's haul of nine is the joint highest in the Super 10 stage. England's spinners have taken only eight wickets collectively in 24 overs.
| Team | Overs | Runs | Wkts | Ave | Econ |
| New Zealand | 36.4 | 188 | 20 | 9.40 | 5.12 |
| England | 24.0 | 238 | 8 | 29.75 | 9.91 |
4.97 The economy rate for Ish Sodhi, the second best - after Sulieman Benn - among bowlers who have bowled at least ten overs in the Super 10 stage of this World T20. New Zealand have played on spin-friendly surfaces in this tournament, but even so, Sodhi's economy rate is well above par: in the four matches New Zealand have played, the overall economy rate for bowlers other than Sodhi is 6.69, which means he has conceded 1.72 runs fewer per over than the other bowlers. For Mitchell Santner, the corresponding difference is 0.86.
The England spinners have been far more expensive, in absolute terms and in terms of comparison with other bowlers in the matches they played. Given that England have played a couple of their matches in Mumbai, the economy rates for their bowlers is obviously high, but both their main spinners have poorer economy rates than the average for other bowlers in the matches they've played. Adil Rashid has conceded 0.66 runs more per over than the average, while Moeen Ali has gone for 1.35 more runs per over.
| Bowler | Overs | Wkts/runs | Econ rate | ER factor* |
| Ish Sodhi | 15.4 | 8/78 | 4.97 | 1.72 |
| Mitchell Santner | 15.0 | 9/86 | 5.73 | 0.86 |
| Adil Rashid | 11.0 | 4/104 | 9.45 | -0.66 |
| Moeen Ali | 12.0 | 4/121 | 10.08 | -1.35 |
162.33 Martin Guptill's strike rate in this tournament, third among the 17 batsmen who have scored at least 100 runs since the start of the Super 10s. In 77 balls, Guptill has made 125 runs. His strike rate is also remarkable because the games he has been involved in have been pretty low-scoring ones; in fact, the average strike rate of other batsmen in the three games he has played has been 102.84, which means he has scored 59.49 more runs per 100 balls than the other batsmen in these three matches. Similarly, Ross Taylor has a positive strike rate factor of 13.12, but for their other three top-order batsmen - Kane Williamson, Colin Munro and Corey Anderson - this strike rate factor is in the negative, which means their strike rate is lesser than the average strike rate of other batsmen in these matches. Anderson's strike rate in the tournament is only 89.23, almost 18 below par.
| Batsman | Inngs | Runs | SR | SR factor* |
| Martin Guptill | 3 | 125 | 162.33 | 59.49 |
| Ross Taylor | 4 | 85 | 118.05 | 13.12 |
| Kane Williamson | 4 | 91 | 102.24 | -4.11 |
| Colin Munro | 4 | 72 | 101.40 | -4.93 |
| Corey Anderson | 4 | 58 | 89.23 | -17.99 |
2 England batsmen who have scored 100-plus runs at a strike rate of 150 or more in this tournament - Jos Buttler (123 runs at 151.85) and Joe Root (168 runs at 150). However, England have been involved in very high-scoring games as well - the average strike rate in their four matches is 139.78, compared to 105.95 in the four matches New Zealand have played. Doing a similar strike rate comparison for England's batsmen, only Buttler and Root have a positive strike rate factor. Alex Hales has a strike rate of only 121.62 in the three games he has played; the average strike rate of other batsmen in those three games was 153.64, a difference of -32.02.
| Batsman | Inngs | Runs | SR | SR factor* |
| Jos Buttler | 4 | 123 | 151.85 | 13.18 |
| Joe Root | 4 | 168 | 150.00 | 11.58 |
| Jason Roy | 4 | 105 | 136.36 | -3.73 |
| EoinMorgan | 4 | 61 | 132.60 | -7.55 |
| Alex Hales | 3 | 45 | 121.62 | -32.02 |
S Rajesh is stats editor of ESPNcricinfo. @rajeshstats