India's opening woes, WI's finishing trouble
Stats preview of the second semi-final of World T20 2016 between India and West Indies at Wankhede
Bharath Seervi
30-Mar-2016
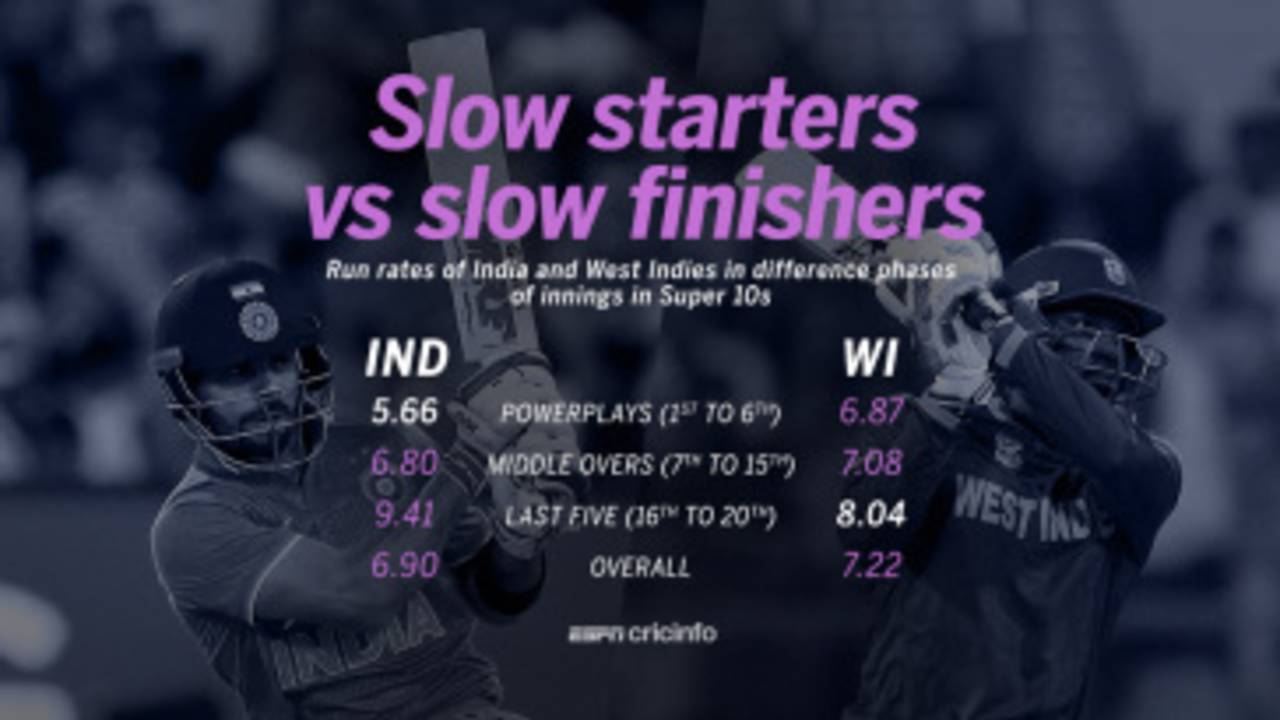
India have the lowest run rate in Powerplays and West Indies have the lowest in the final five overs among all teams in the Super 10s • ESPNcricinfo Ltd
2-2 Head-to-head record for India and West Indies in T20Is. Three of those were in the World T20. The semifinal will be the first match between the two teams in India.
2-0 India's win-loss record in World T20 semi-finals. They had beaten Australia by 15 runs in Durban in 2007, and South Africa by six wickets in Dhaka in 2014. On the other hand, West Indies have lost two of their three semi-finals: won in 2012, and lost in 2009 and 2014.
199 Average first-innings score in four T20Is at Wankhede. The totals have been: 177, 182, 209 and 229. Three of those scores were chased down. The only team that failed to do so was Afghanistan, who managed 172 chasing South Africa's 209. The average first-innings score in 14 matches in the last two editions of the IPL has been 182.
5.66 India's run rate in the Powerplay overs this tournament, the lowest for any team in the Super 10 stage. They are the only team to score at less than run-a-ball and have also lost the most wickets (10), averaging 13.60 per wicket. West Indies have scored at 6.87 and average 27.50 per wicket in the same phase.
| Team | Powerplays (first 6 overs) | Middle overs (7th to 15th) | Death overs (16th to 20th) |
| India | 5.66 | 6.80 | 9.41 |
| West Indes | 6.87 | 7.08 | 8.04 |
8.04 West Indies' run rate in the last five overs of the innings (16 to 20), the lowest among all teams in the Super 10 stage. In their last two games - against South Africa and Afghanistan - they scored at 6.85 and 6.60 in the last five overs. India, despite their poor Powerplay show, have scored at 9.41 in the final five, the fourth-highest run rate among all teams. In the middle overs (7th to 15th), both teams are pretty similar - a run rate of 6.80 for India, losing eight wickets, and 7.08 for West Indies for the loss of nine wickets.
184 Runs scored by Virat Kohli, the most by any batsman in the Super 10s. He has a strike rate of 132.37 and an average of 92. However, the performances of the other four batsmen in India's top five have been poor. Rohit Sharma, Shikhar Dhawan, Suresh Raina and Yuvraj Singh have a combined tally of 181 runs. The next highest scorer for India in the Super 10s is MS Dhoni with 74 runs. Kohli has contributed 38.17% of the runs scored by India's batsmen so far, and 39.55% of them in wins.
| Batsmen | Runs | Balls | Ave | SR | 4s + 6s |
| Virat Kohli | 184 | 139 | 92.00 | 132.37 | 22 |
| Rohit Sharma, Shikhar Dhawan, Suresh Raina, Yuvraj Singh | 181 | 188 | 11.31 | 96.27 | 20 |
11.00 Average of India's openers, the lowest among all teams in the Super 10s. Rohit Sharma and Shikhar Dhawan have scored 88 runs in eight innings. India's openers have scored the fewest runs, faced the fewest balls (103), have the lowest average (11.00) and also the lowest strike rate (85.43). The West Indies openers' average 42, the highest among all teams. They have scored 252 runs, the second-highest aggregate, and also have the second-best strike rate (135.48). Their openers have hit 16 fours and 19 sixes, compared to India's eight fours and three sixes. The highest score by an India opener is 23, whereas for West Indies, Chris Gayle scored an unbeaten 100 against England and Andre Fletcher smashed 84 not out against Sri Lanka.
| Team | Runs | Ave | SR | 50+ | HS | 4s+6s | MoM |
| India | 88 | 11.00 | 85.43 | 0 | 23 | 11 | 0 |
| West Indies | 252 | 42.00 | 135.48 | 2 | 100* | 35 | 2 |
5.24 Economy rate of West Indies' spinners, second only to New Zealand in the Super 10s. Samuel Badree and Sulieman Benn - their frontline spinners - have conceded 5.46 and 4.93 per over respectively. Badree has picked up six wickets, but Benn has only two scalps. Gayle bowled only once, against South Africa, and picked up two wickets with an economy of 5.66. Their spinners have collected 10 wickets at an average of 17.30. India's spinners have been effective as well, with an economy of 6.24 and average of 19.25 for 12 wickets. But, they have conceded 18 extras (no balls and wides), which is the most by any team, whereas the West Indies spinners have conceded just one extra.
51.33 Gayle's average against India in T20Is. He has scored 154 runs in three innings at a strike rate of 121.25, with a best of 98 off 66 balls in the 2010 World T20. In the other two innings, he has scored 56 runs at strike rate of 109.80. India is the only opposition against whom Gayle averages more than 50 in this format. He is the only batsman to have scored more than 100 runs in the matches between these two sides. In the bowling department, Darren Sammy and Dwayne Bravo have picked the most wickets - five each.
4 Number of times R Ashwin has dismissed Gayle in nine innings in all T20s. He has conceded just 57 runs off 70 balls, and bowled 40 dot balls. He has bowled 51 of those deliveries in the first six overs. In T20Is, they have faced each other only once. Gayle struggled in that innings too, scoring eight runs in 11 balls with no boundaries.
| Format | Inns | Runs | Balls | Dots | 4s/6s | Ave | SR | Dismissals |
| T20Is | 1 | 8 | 11 | 4 | 0/0 | - | 72.72 | 0 |
| All T20s | 9 | 57 | 70 | 40 | 3/3 | 14.25 | 81.42 | 4 |
Bharath Seervi is stats sub-editor at ESPNcricinfo. @SeerviBharath