Chasing glory in the IPL
Teams batting second have had more success than ever before this season, while batsmen have taken power-hitting to a new high in the slog overs
S Rajesh
30-May-2014
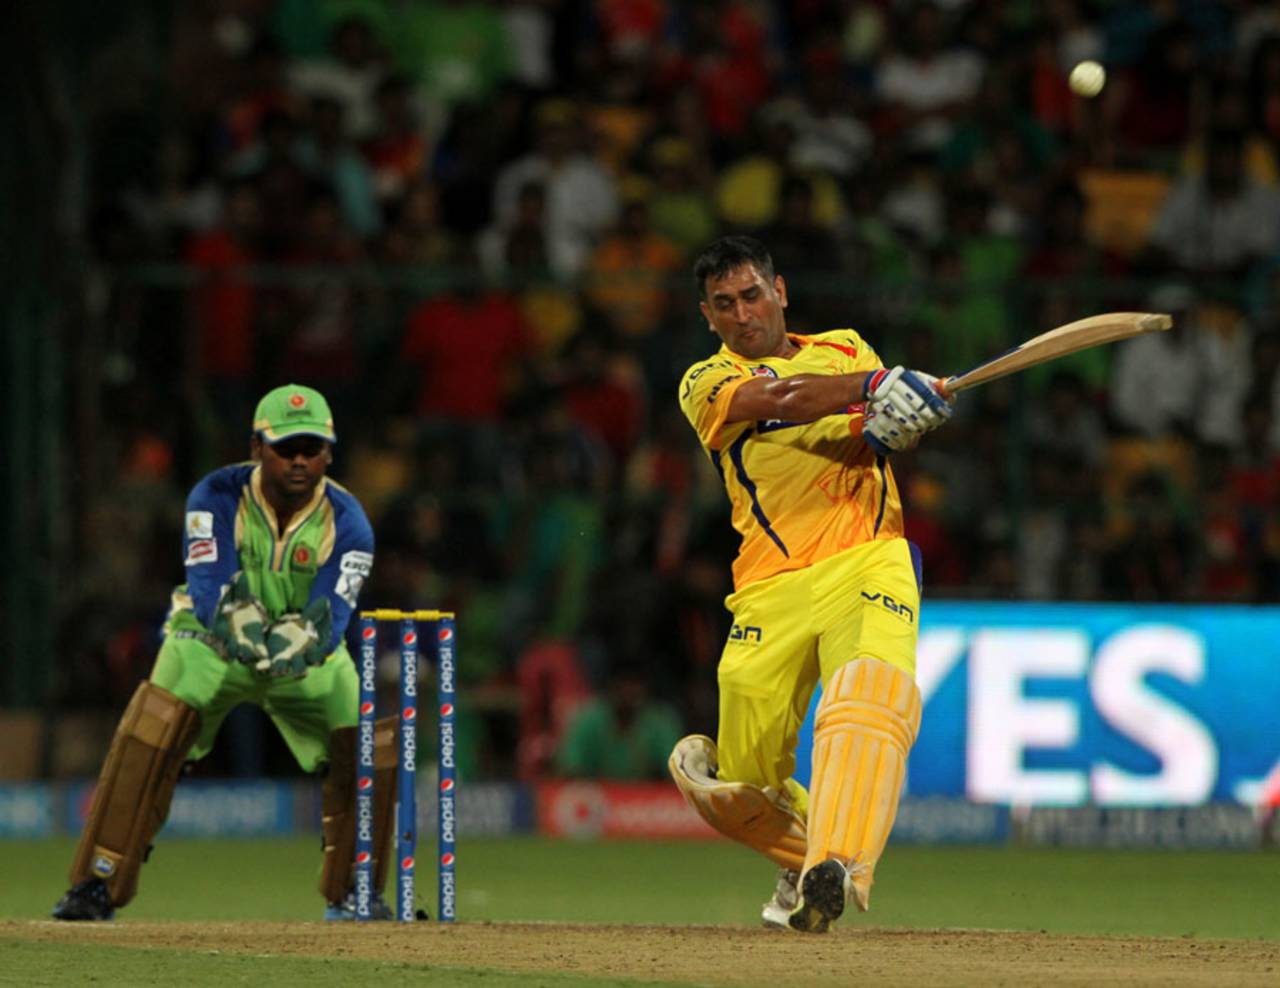
With batsmen like MS Dhoni in full cry, bowlers haven't had much of a chance in the last few overs in IPL 2014 • BCCI
IPL 2014 has witnessed some incredible batting performances from teams in chases. It started with Kings XI Punjab chasing down 193 against Rajasthan Royals in 18.4 overs in Sharjah, and they then bettered it by getting 211 against Sunrisers Hyderabad when the tournament came to India. Both those efforts were outstanding ones, but the bar was raised even higher on the last couple of days of the league stage, when teams overcame the pressures of must-win situations to go past challenging targets with incredible ease.
First it was the turn of Kolkata Knight Riders, who chased down 161 in a mere 14.2 overs to pip Chennai Super Kings and finish second on the points table. Even greater drama was in store the next day, when Mumbai Indians romped to 195 in 14.4 overs to seal the last playoff berth ahead of Royals.
The results in the last two matches, especially, is an indicator of how much teams have preferred to chase, compared to batting first, in IPL 2014. Overall, out of 58 matches played in the tournament so far, 36 have been won by the team batting second, and only 21 by the team batting first. (One game, between Knight Riders and Royals, was tied and went into the Super Over.) The win-loss ratio of 1.71 is the best across all IPL seasons, marginally better than the 1.63 in 2008. Taking only the 38 matches that have been played in India so far, the difference is even more stark - 25 wins for the team chasing, and only 13 for the team batting first, a ratio of 1.92. In all years except 2010, the team batting second has had the advantage, but it's usually been a more marginal one.
Super Kings have been the most dominant side in chases, with a 7-1 win-loss record, followed by Kings XI's 6-1. Those records suggest that whichever team wins the toss in the second qualifier will almost certainly choose to bat second.
| Season | Matches | W/ L | Ratio | Bat ave | Run rate |
| 2014 (overall) | 58 | 36/ 21 | 1.71 | 28.60 | 8.10 |
| 2014 (in India) | 38 | 25/ 13 | 1.92 | 31.27 | 8.44 |
| 2013 | 76 | 37/ 37 | 1.00 | 23.14 | 7.47 |
| 2012 | 75 | 40/ 34 | 1.17 | 25.28 | 7.71 |
| 2011 | 73 | 40/ 32 | 1.25 | 26.05 | 7.66 |
| 2010 | 60 | 28/ 31 | 0.90 | 25.43 | 7.99 |
| 2009 | 57 | 30/ 26 | 1.15 | 23.57 | 7.37 |
| 2008 | 58 | 36/ 22 | 1.63 | 29.05 | 8.39 |
Teams batting second have won a lot, but not all captains have caught on to that fact in IPL 2014, which is why the win-loss record for teams winning the toss is only 0.96, which essentially means winning the toss hasn't mattered a jot over the entire course of the tournament. Obviously, some teams have taken advantage of the coin falling in their favour: Super Kings and Royal Challengers Bangalore both won the toss nine times, but Super Kings had a 6-3 win-loss, while it was the reverse for Royal Challengers. Kings XI had a 5-2 record, while Delhi Daredevils lost all four matches when they won the toss. Interestingly, in each of the last three seasons, the teams winning the toss have won fewer matches than they've lost.
In these 58 matches this season, the team winning the toss has chosen to field 39 times, and have a 23-16 record, but batting first backfired more than two-thirds of the time: in 19 matches when teams have won the toss and batted, they've won only five and lost 13. The win-loss of 0.38 is easily the worst of all seasons - the previous worst among all IPL seasons had been 2008, when teams winning the toss and batting had a 9-17 record.
| Season | Matches | W/ L | Ratio |
| 2009 | 57 | 33/ 23 | 1.43 |
| 2011 | 73 | 38/ 34 | 1.11 |
| 2010 | 60 | 31/ 28 | 1.10 |
| 2014 | 58 | 28/ 29 | 0.96 |
| 2008 | 58 | 28/ 30 | 0.93 |
| 2013 | 76 | 35/ 39 | 0.89 |
| 2012 | 75 | 33/ 41 | 0.80 |
Over-wise stats from IPL 2014
One of the features of this year's IPL has been the incredible hitting witnessed in the last few overs of an innings, especially in the matches played in India. That's evident in the over-by-over stats for the tournament. The overall run rate for the last over in this tournament has been 11.61; in the Indian leg it's been 12.25. In 2011 the last-over run rate had been 10.21, in 2012 it'd been 10.32, and last year 11.26. In the Indian leg this year, teams have raised the bar even further. In 2014, there've been three instances of teams scoring more than 20 runs in the last over - 27 by Royal Challengers versus Delhi Daredevils, 24 by Super Kings against Sunrisers, and 23 by Kings XI against Super Kings - and 19 instances of 15 or more in the last over.
Also, teams have changed to fourth gear from the 15th over, on average: the last six overs during the Indian leg has fetched an average of 61 runs, while over the entire tournament the average has been 59. The Powerplay overs have been relatively quieter, with an average of 44 over the entire tournament.
The other aspect that's noticeable is the number of wickets lost in the early overs in the UAE and in India. In the UAE, 13 wickets fell in the first two overs, in just 20 matches; since the tournament has moved to India, only eight wickets have fallen in the first two overs, in 38 matches. Clearly, the new ball hasn't been as much as problem for the top-order batsmen in India.
In the Indian leg, overs one to three and seven to ten are the only ones where the average rate is less than eight an over: teams have generally tended to take it easy at the start of their innings, and then immediately after the Powerplays as well. After the tenth over, teams have switched gears and gone into acceleration mode, resulting in average scoring rates which are much higher than the last few seasons: in 2008, the average was 8.30 per over, and in the Indian leg this year it's 8.42; in the three years before this the rates were 7.67, 7.82 and 7.72. After a few good IPL seasons, the bowlers have been found out this season - clearly, they have some catching up to do.
| In the UAE | In India | Overall | |||||
| Over No. | Wickets | Average | Run rate | Wickets | Average | Run rate | Run rate |
| 1 | 5 | 25.00 | 6.25 | 4 | 62.00 | 6.52 | 6.43 |
| 2 | 8 | 13.50 | 5.40 | 4 | 57.75 | 6.07 | 5.84 |
| 3 | 9 | 15.67 | 7.05 | 12 | 23.16 | 7.31 | 7.22 |
| 4 | 5 | 24.60 | 6.15 | 6 | 55.00 | 8.68 | 7.81 |
| 5 | 4 | 40.75 | 8.15 | 8 | 39.50 | 8.31 | 8.25 |
| 6 | 2 | 91.00 | 9.10 | 13 | 23.92 | 8.18 | 8.50 |
| 7 | 5 | 25.00 | 6.25 | 7 | 34.71 | 6.39 | 6.34 |
| 8 | 3 | 41.67 | 6.25 | 5 | 59.60 | 7.84 | 7.29 |
| 9 | 4 | 32.75 | 6.55 | 12 | 22.67 | 7.15 | 6.94 |
| 10 | 3 | 47.33 | 7.10 | 7 | 41.00 | 7.55 | 7.39 |
| 11 | 6 | 25.50 | 7.65 | 8 | 39.87 | 8.39 | 8.13 |
| 12 | 5 | 26.20 | 6.55 | 8 | 40.87 | 8.60 | 7.89 |
| 13 | 1 | 161.00 | 8.05 | 10 | 31.70 | 8.34 | 8.24 |
| 14 | 7 | 20.14 | 7.05 | 6 | 51.83 | 8.18 | 7.79 |
| 15 | 6 | 31.33 | 9.40 | 16 | 22.18 | 9.34 | 9.36 |
| 16 | 5 | 30.80 | 8.10 | 9 | 42.00 | 9.94 | 9.33 |
| 17 | 7 | 25.14 | 9.26 | 16 | 19.43 | 8.18 | 8.54 |
| 18 | 9 | 18.67 | 8.84 | 17 | 21.88 | 10.05 | 9.64 |
| 19 | 15 | 12.53 | 9.89 | 21 | 18.90 | 10.97 | 10.60 |
| 20 | 11 | 18.00 | 10.42 | 33 | 13.18 | 12.25 | 11.61 |
S Rajesh is stats editor of ESPNcricinfo. Follow him on Twitter