Australia's latest ODI batting star
George Bailey has played only 31 ODI innings, but during this period he has racked up astonishing numbers
S Rajesh
25-Oct-2013
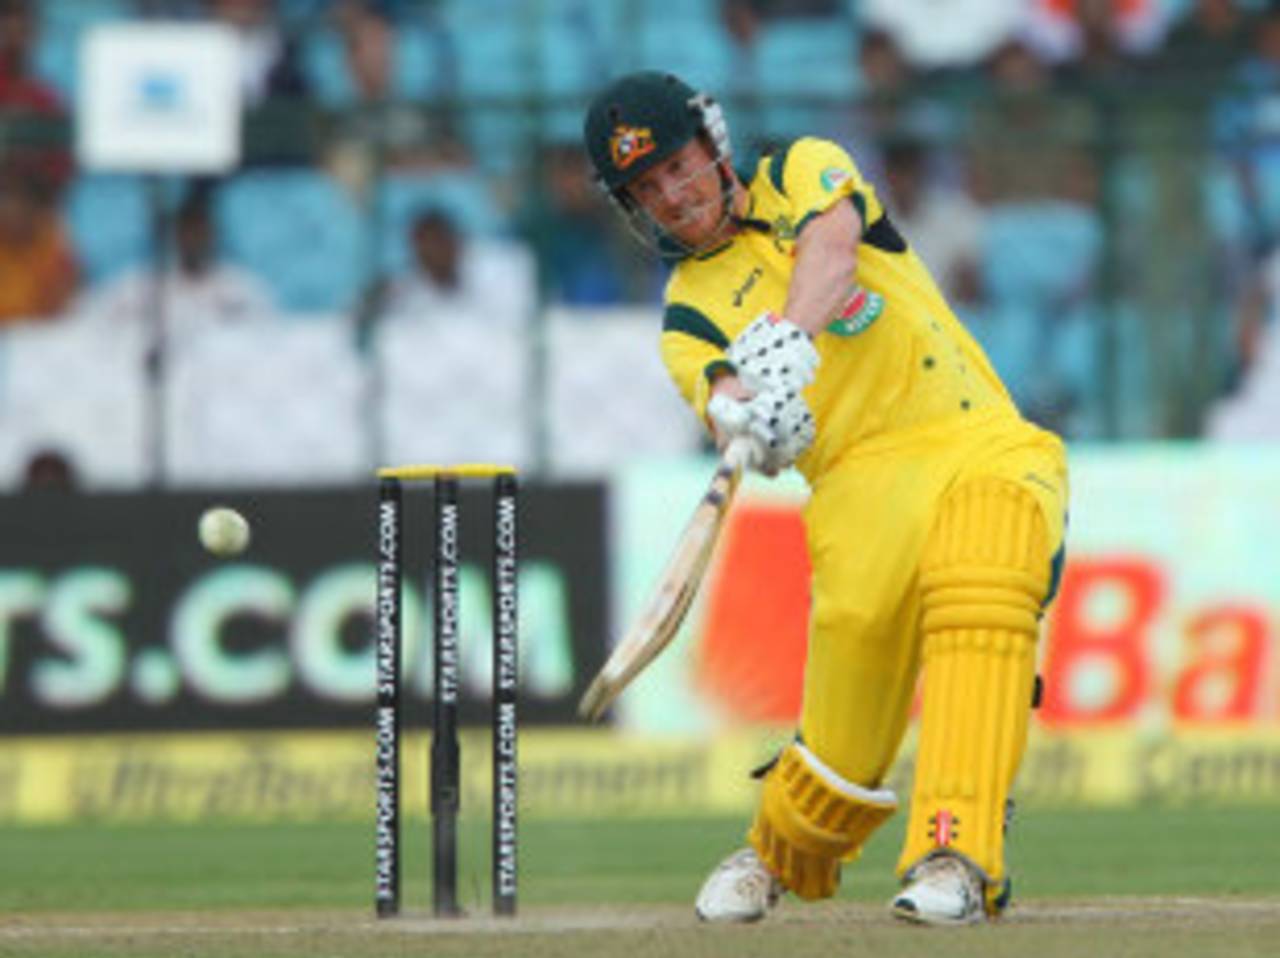
In non-international one-day matches, George Bailey averages only 33, but in ODIs it goes up by almost 60% • BCCI
George Bailey's record in domestic one-day matches is solid, but far from outstanding: in 128 innings he averages 33.37 at a strike rate of 83.69, with 27 scores of 50 or more, which means he notches up one such score every 4.74 innings. Since the beginning of the 2005-06 season, he has averaged 36.41 in 86 one-day matches - domestic and international - in Australia, and 36.27 in 75 innings for Tasmania in this format.
These are good numbers, but hardly the kind to make your eyes pop out, for other Australians have done much better at home during this period: Michael Klinger averages 48.26 from 80 innings, Brad Hodge 54.62 at a strike rate of 90.29, Adam Voges 46.83 in 75 innings, Shaun Marsh 42.14 in 74, and David Hussey 41.57 at a strike rate of 93 in 107 innings.
In the 19 months that he has played one-day internationals, though, Bailey has lifted his game several levels. In 31 ODI innings, he averages 53.03, and improvement of almost 60% over his average in domestic one-day matches.
The sort of consistency he has shown recently, especially, is staggering: in his last seven innings he has scores of 82, 87, 4, 85, 92*, 43, and 98 - 491 runs at an average of 81.83, and a strike rate of 107. In 18 innings in 2013, Bailey has averaged 62.53, scored his runs at almost a run a ball, and gone past 50 once every two innings. The average hasn't been inflated unduly by not-outs either, with only three of those in his 18 innings. Add the fact that Bailey's captained the team in ten matches this year, and you get an idea of just how influential he has been to Australia's ODI team in these last 19 months.
| Innings | Runs | Average | Strike rate | 100s/ 50s | |
| In one-day internationals | 31 | 1379 | 53.03 | 89.48 | 1/ 11 |
| In non-international one-day matches | 139 | 3838 | 33.37 | 83.69 | 5/ 22 |
It obviously remains to be seen how well Bailey can maintain these sort of numbers over a longer period, but regardless of that, it's clear that he has already stacked up very impressive stats over a fairly substantial period of time. No Australian batsman has scored as many as he has after 31 ODI innings - Greg Chappell got the closest, scoring 1298 runs at 56.43. Chappell is also one of three Australians to average higher than Bailey after 31 innings.
Michael Hussey averaged 77.06 at this stage of his career, but that was also because he was unbeaten in more than half those innings - he had 16 not-outs in 31 outings. Similarly, Michael Bevan's average was boosted to 63.93 because of 15 not-outs. Bailey, on the other hand, has been unbeaten only five times in his 31 innings.
| Batsman | Runs | Average | Strike rate | 100s/ 50s |
| Michael Hussey | 1156 | 77.06 | 97.38 | 0/ 9 |
| Michael Bevan | 1023 | 63.93 | 76.51 | 0/ 6 |
| Greg Chappell | 1298 | 56.43 | 74.94 | 2/ 7 |
| George Bailey | 1379 | 53.03 | 89.48 | 1/ 11 |
| Michael Clarke | 936 | 40.69 | 89.91 | 1/ 4 |
| Dean Jones | 801 | 36.40 | 84.22 | 0/ 4 |
| Darren Lehmann | 924 | 35.53 | 80.34 | 1/ 6 |
| Matthew Hayden | 968 | 33.37 | 68.89 | 1/ 8 |
| David Boon | 1027 | 33.12 | 66.38 | 1/ 5 |
| Adam Gilchrist | 864 | 32.00 | 83.23 | 2/ 4 |
| Shane Watson | 588 | 30.94 | 72.23 | 0/ 3 |
| Ricky Ponting | 866 | 30.92 | 70.17 | 2/ 5 |
| Allan Border | 819 | 28.24 | 60.04 | 1/ 4 |
| Andrew Symonds | 693 | 27.72 | 103.27 | 0/ 2 |
| Damien Martyn | 645 | 25.80 | 79.62 | 0/3 |
| Mark Waugh | 673 | 24.03 | 87.97 | 0/ 3 |
The year 2013 has been particularly profitable for Bailey - last year, he scored 441 runs in 13 innings, averaging 40.09 at a strike rate of 77.50; this year, his 938 runs have come at an average of 62.53, and a strike rate of 96.50. Multiplying the average by the runs scored per ball gives an index score of 60.34.
Only two Australian batsmen have achieved a higher score in a calendar year (with a cut-off of 900 runs): in 2007, Ricky Ponting was in spectacular form, scoring five centuries and eight fifties in 24 innings; in 2011, another World Cup year, Shane Watson made two huge unbeaten hundreds - 161 against England and 185 aganst Bangladesh - and finished with an average of almost 57 and a strike rate of 109 from 22 innings. In 2007 Matthew Hayden was outstanding too, averaging almost 60 at a strike rate of 89, which explains largely why Australia were so successful that year.
| Batsman | Year | Inngs | Runs | Average | Strike rate | 100s/ 50s | Ave*SR/100 |
| Ricky Ponting | 2007 | 24 | 1424 | 79.11 | 91.69 | 5/ 8 | 72.54 |
| Shane Watson | 2011 | 22 | 1139 | 56.95 | 108.89 | 2/ 8 | 62.01 |
| George Bailey | 2013 | 18 | 938 | 62.53 | 96.50 | 1/ 8 | 60.34 |
| Michael Bevan | 1998 | 22 | 959 | 68.50 | 81.68 | 1/ 8 | 55.95 |
| Dean Jones | 1990 | 22 | 1174 | 69.05 | 78.84 | 4/ 7 | 54.44 |
| Matthew Hayden | 2007 | 30 | 1601 | 59.29 | 89.19 | 5/ 6 | 52.88 |
| Michael Bevan | 1999 | 28 | 949 | 67.78 | 76.59 | 0/ 8 | 51.91 |
| Michael Clarke | 2011 | 22 | 900 | 56.25 | 79.64 | 1/ 6 | 44.80 |
| Michael Hussey | 2009 | 31 | 1166 | 48.58 | 90.80 | 0/ 11 | 44.11 |
| Michael Clarke | 2005 | 25 | 954 | 53.00 | 82.67 | 1/ 8 | 43.81 |
| Shane Watson | 2009 | 24 | 1013 | 50.65 | 84.48 | 3/ 3 | 42.79 |
| Ricky Ponting | 1998 | 24 | 1166 | 53.00 | 76.91 | 3/ 6 | 40.76 |
However, while Ponting and Hayden were both in stunning form in 2007, in these last 19 months Bailey is the only one who has consistently scored runs. The only other Australian batsman who's scored more than 400 runs at a 40-plus average is Adam Voges. There've been centuries from several other batsmen, but they haven't contributed as consistently as the team would've liked them to. The biggest disappointment has been David Warner, who has averaged less than 25 from 17 innings.
| Batsman | Innings | Runs | Average | Strike rate | 100s/ 50s |
| George Bailey | 31 | 1379 | 53.03 | 89.48 | 1/ 11 |
| Shane Watson | 22 | 798 | 36.27 | 90.78 | 2/ 4 |
| Michael Clarke | 17 | 628 | 39.25 | 77.24 | 1/ 4 |
| Phil Hughes | 17 | 624 | 39.00 | 75.18 | 2/ 2 |
| Aaron Finch | 15 | 489 | 32.60 | 93.14 | 1/ 2 |
| Glenn Maxwell | 17 | 442 | 34.00 | 122.77 | 0/ 4 |
| Adam Voges | 12 | 430 | 47.77 | 83.33 | 1/ 2 |
| David Hussey | 18 | 417 | 24.52 | 84.41 | 0/ 3 |
| David Warner | 17 | 417 | 24.52 | 72.39 | 0/ 3 |
In the ODIs he has played so far, Bailey has mostly batted at Nos. 4 and 5, and as the tables below show, he has adapted his game well to the needs of the team. When he has come in early, Bailey's taken his time to score runs, but has mostly preserved his wicket even if the runs have come slowly. In the middle overs, he has scored briskly without relying too much on boundaries. His relatively low number of dismissals - and consequently the high average of 57 - suggests he has largely played risk-free cricket during this phase. In the period since his debut, no batsman has scored more runs than his 912 during the middle overs; Misbah-ul-Haq is next with 901 runs at an average of 69.30 and a run rate of 4.11.
After scoring all those runs in the middle overs, Bailey has also been able to turn it up a couple of gears during the slog, scoring at nine an over and yet achieving a healthy average of more than 42 runs per dismissal while doing so. His dot-ball percentage reduces drastically to 27% during this period, while the boundary percentage rises to nearly 60%, which is exactly what you'd what of a good batsman during the slog overs. In fact, only MS Dhoni (415 runs at an average of 59.28 and run rate of 8.98) has scored more runs in the slog in the last 19 months.
All of this adds up to a batsman who clearly understands the demands of ODI cricket, and has geared his game to meet the challenges of the format. So far in his brief ODI career, he hasn't been as effective when batting second (average 35.66, strike rate 70.39), but then he has batted only seven times in run-chases. When batting first, he has been a powerhouse, averaging 58.25 at a strike rate of 94, stats which have turned him from an also-ran into Australia's most important cog in their ODI batting wheel.
| Runs scored | Balls faced | Dot % | 4s/ 6s | % boundary runs |
| 1379 | 1541 | 48.93 | 107/ 30 | 44.09 |
| Runs | Balls | Dismissals | Average | Run rate | |
| Pace | 823 | 881 | 16 | 51.43 | 5.60 |
| Spin | 556 | 660 | 9 | 61.77 | 5.05 |
| Runs | Balls | Dismissals | Average | Run rate | Dot % | Boundary % | |
| 0-15 overs | 126 | 204 | 1 | 126.00 | 3.70 | 65.68 | 44.44 |
| 15.1 to 40 overs | 912 | 1110 | 16 | 57.00 | 4.92 | 50.27 | 38.60 |
| 40.1 to 50 overs | 341 | 227 | 8 | 42.62 | 9.01 | 27.31 | 58.65 |
S Rajesh is stats editor of ESPNcricinfo. Follow him on Twitter