Tendulkar and Kohli in ODI chases: who's better?
A proper assessment needs to take the rest of the team into account
Kartikeya Date
18-Sep-2017
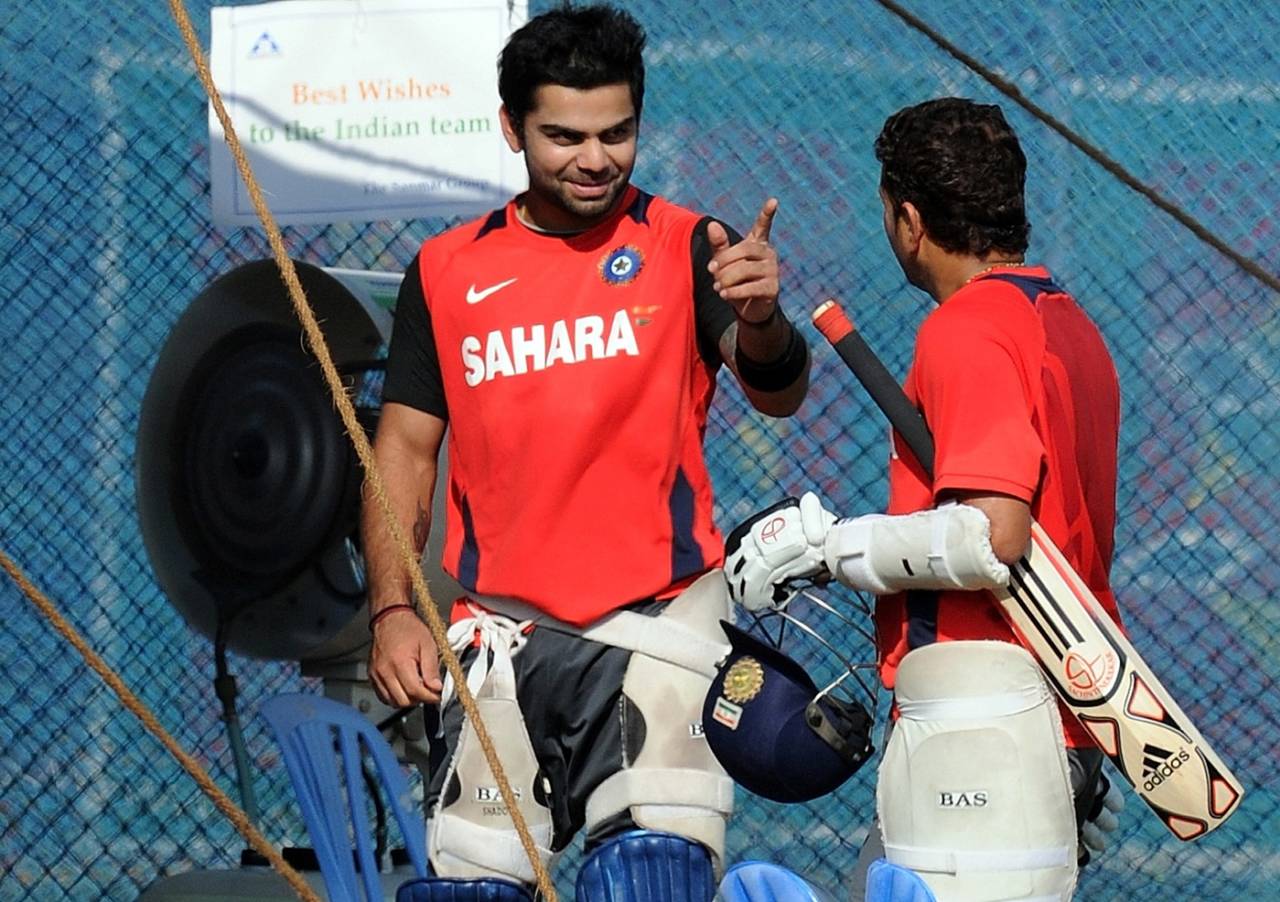
263 runs per innings v 280, but it's not as clear-cut as all that • AFP
The statistics presented here are current up to the end of the Sri Lanka-India ODI series. Only results against the eight oldest Test-playing nations are considered in all data presented here
This article follows on from this one, which asked how Virat Kohli ranked in comparison to ODI greats of the past, such as Sachin Tendulkar and Viv Richards.
A central reason for the high regard in which observers hold Virat Kohli is his record in run chases, which is, without question, superb. At the time of writing, in successful run chases, Kohli averages 95, an all-time high for any player who has participated in at least 20 successful run chases. In all run chases, he averages 64. This is also an all-time high. AB de Villiers averages 90 in wins and 60 overall. MS Dhoni also averages 90 in wins. In terms of raw numbers, these are phenomenal. It is impossible to achieve these numbers without belonging in the most elite group in any era so far.
While consistency is one reason why many observers rate Kohli to be exceptional, they rate him above Sachin Tendulkar for a different reason. The perception is that Kohli tends to finish run chases while Tendulkar didn't in his day; judging by the raw numbers, they are not unforgivably wrong in thinking this. When Kohli plays in chases, India have won 55 and lost only 36 ODIs. When Tendulkar played in chases, they won 97 and lost 97. Fans like winners. And they remember players who were there at the end. In this, cricket fans are not abnormal, and are affected by the availability bias. Wins and winning moments are memorable; hence they seem to be more significant in later assessments.
India have now had a very successful ODI side for a dozen years under Rahul Dravid, Dhoni and now Kohli. The captaincy eras of Sourav Ganguly, Mohammad Azharuddin and Tendulkar are a distant memory. Under each of those captains, India had a losing record, with 134 wins and 174 defeats overall. Under Dravid, Dhoni and Kohli, India have a combined record of 147 wins and 110 defeats.
The outstanding player of the outstanding era must be exceptional. Before Kohli, it was Dhoni. Before Dhoni, it was Tendulkar. But there has always been an asterisk against Tendulkar's name. It seemed to affect him too. More than once, in interviews, the acknowledged supreme batsman of his day would earnestly say that he wanted to win games for India. This in an era in which it was the norm for India to lose, for every opponent who visited Indian shores to be a contender to be reckoned with, and for every overseas limited-overs series to engender hope rather than the expectation that India would be competitive. Those were not the days of India handing out five-nil thrashings to anybody.
If you want to see exceptional individual performance over a period of time, then this is far more likely to be found in a struggling team than in a successful team
In reality, Tendulkar and Kohli have had the same amount of (limited) influence on India's results. It is the players at the other end who account for the difference between the results achieved in Tendulkar's era and those achieved in Kohli's. Here are the figures to prove it.
The table below shows the average target, wins and losses for 11 different players in run chases involving these players. It also shows the player's record and that of the player's team-mates in these chases. To enable ready comparison, the player's average and scoring rate have been converted into an expected total over 300 balls faced, and the number of balls faced per dismissal is listed. As long as the player's dismissal rate is better than 30 balls faced per dismissal, the expected total is simply the scoring rate over 300 balls. In other cases, it is ten times the batting average. The same has been done for team-mates. The final two columns show the extent to which the player or his team-mates exceed or fall short of the average target.
For example, in chases involving Dhoni, the average target was 266. In these chases, Dhoni scored at a rate that would produce 241 runs in 300 balls. At the other end, the scoring rate was 288 runs per 300 balls. However, Dhoni was dismissed once every 58.3 balls, while at the other end, a wicket fell every 32.3 balls. The pattern of chases under Dhoni saw him effectively anchoring the chase, letting the scoring risks fall to the other end. Much of the risk-taking often happened before Dhoni got to the wicket. His apparent mastery in the run chase was made possible by the hitting firepower at the other end. His own hitting ability was a in a sense, a reserve. The result was 79 wins and 58 defeats.
Michael Bevan was similar to Dhoni as a player, capable of scoring boundaries (he once made 185 in 132 against Wasim Akram, Chaminda Vaas, Anil Kumble, Muttiah Muralitharan and Abdur Razzaq) but better known for playing a measured game. When Bevan played for Australia in run chases, the average target they faced was 230. At the end of his career, Bevan scored at a rate of 204 runs per 300 balls, 11.3% slower than the target demanded. However, at the other end, the runs came at the rate of 229 runs per 300 balls, almost the asking rate.
It is expected that the figures for a given batsman and team-mates can fall short of the average target score in this table. This is because chasing teams score only one run more than the target when they win, but they can lose by any number of runs.
| Player | Target | Wins | Losses | Player runs | Balls faced/dismissal | Team runs | Team BF/dismissal | Player run delta | Team run delta |
| Kohli | 270 | 55 | 36 | 280 | 68.2 | 252 | 36.6 | 3.7% | -6.7% |
| Dhoni | 266 | 79 | 58 | 241 | 58.3 | 288 | 32.3 | -9.4% | 8.3% |
| de Villiers | 262 | 52 | 37 | 287 | 62.8 | 248 | 36.1 | 9.5% | -5.3% |
| Sehwag | 262 | 57 | 49 | 302 | 33.2 | 230 | 39.2 | 15.3% | -12.2% |
| Tendulkar | 253 | 97 | 97 | 263 | 45.6 | 220 | 36.9 | 4.0% | -13.0% |
| Tendulkar (1989-05) | 249 | 64 | 73 | 267 | 47.9 | 212 | 36.6 | 7.2% | -14.9% |
| Tendulkar (2005-12 | 259 | 36 | 24 | 254 | 39.9 | 238 | 38.7 | -1.9% | -8.1% |
| Inzamam | 244 | 77 | 70 | 219 | 56.5 | 220 | 37.8 | -10.2% | -9.8% |
| Ponting | 236 | 88 | 43 | 230 | 53.1 | 233 | 41.7 | -2.5% | -1.3% |
| Lara | 234 | 70 | 70 | 231 | 56.4 | 206 | 35.3 | -1.3% | -12.0% |
| Gilchrist | 233 | 73 | 34 | 296 | 39.3 | 224 | 44.5 | 27.0% | -3.9% |
| Bevan | 230 | 62 | 34 | 204 | 80.8 | 229 | 38.5 | -11.3% | -0.4% |
| V Richards | 202 | 73 | 29 | 259 | 52.6 | 187 | 49.4 | 28.2% | -7.4% |
At the other end of the spectrum from Dhoni and Bevan we find Virender Sehwag and Adam Gilchrist - two openers who were willing to take a fast scoring rate with a higher failure rate. On average, Sehwag faced a target of 262 and scored at a rate that would produce 302 in 300 balls. But he was also dismissed once every 33.2 balls. At the other end, the runs came at the rate of 230 runs per 300 balls, 12.2% slower than the requirement; but the dismissal rate at the other end was a full over lower than that of Sehwag.
Gilchrist faced an average target of 233 and scored at a rate that would produce 296. As in Sehwag's case, the runs at the other end came at a slow rate, 224, but with greater consistency. Australia won 73 and lost 34 of these chases. Gilchrist and Sehwag played more or less in the same era. Much of the difference between the target (233 for Gilchrist, 262 for Sehwag) is due to Australia's superior attack. Some of it is also because Australian grounds were significantly bigger, especially in the early part of Gilchrist's career.
In chases featuring Kohli, India have faced an average target of 270. Kohli's scoring rate would produce 280 runs per 300 balls. At the other end, the performance has been strong - producing 252 in 300 balls at a respectable dismissal rate of 36.6. In other words, Kohli's run production would produce 103.7% of the total, while the run production at the other end would produce 93.3% of the total.
De Villiers has an even more impressive record. The average target faced by South Africa in run chases involving him has been 262. He scores at a rate that is a full 25 runs better while nearly matching Kohli for consistency (a dismissal every 62.8 balls). At the other end, South Africa produce 248 runs at a respectable dismissal rate of 36.1.
Chases involving Kohli have been won by India 55 times and lost 36 times. Chases involved de Villiers have been won by South Africa 52 times and lost 37 times. These records are nearly identical. Yet, despite these facts, the popular perception is the Kohli is an expert at the run chase while de Villiers is not. De Villiers has remained undefeated 26 times in 87 chases and South Africa have won 25 of these games; Kohli has remained undefeated 21 times in 93 chases and India have won 20 of these games. It is not the case that Kohli stays until the end more frequently than de Villiers; perhaps the popular conventional wisdom about de Villiers is wrong.
Tendulkar played ODI cricket for India over four separate decades. The average target India faced in chases involving him was 253. In these games, Tendulkar scored at a rate that would produce 263 runs in 300 balls, and he was dismissed once every 45.6 balls. Left to themselves, the batsmen at the other end would have reached only 220 - 33 runs short on average. Tendulkar's career spanned the whole of the Azharuddin, Ganguly, Dravid and Tendulkar captaincy eras, and the majority of Dhoni's captaincy. From 1989 to 2005, India faced an average target of 249 in run chases involving Tendulkar. In these chases, he scored at a rate that would produce 267 runs per 300 balls. The other batsmen would have produced only 212. This meant that despite Tendulkar, India had a losing record in chases from 1989 to 2005.
From 2005 to 2012, after Dravid and Greg Chappell took the problem of chasing by the scruff of the neck and India had found powerful middle-order players like Yuvraj Singh and MS Dhoni, Tendulkar's contribution to chases declined. He went through an injury-plagued period around 2005 (remember the "Endulkar?" headlines). He then returned, and despite his reduced output (adjusted for inflation), India won 36 and lost only 24 chases during the following seven years. The wins include a World Cup final where they chased; they also won a triangular tournament in Australia chasing a target (Tendulkar made a century in the first final).
In his prime, Tendulkar was an exceptionally brilliant batsman in the run chase. The support at the other end was significantly weaker than it has been for Kohli. This not only meant that Tendulkar had to do a significantly greater amount of heavy lifting compared to Kohli. It also meant that he was hampered in this task a great deal more than Kohli has been.
| Player | Target | Wins | Losses | Player runs | Balls faced/dismissal | Team runs | Team BF/dismissal | Player run delta | Team run delta |
| Kohli | 270 | 55 | 36 | 280 | 68.2 | 252 | 36.6 | +3.7% | -6.7% |
| Tendulkar | 253 | 97 | 97 | 263 | 45.6 | 220 | 36.9 | +4.0% | -13.0 |
| Tendulkar (1989-05) | 249 | 64 | 73 | 267 | 47.9 | 212 | 36.6 | +7.2% | -14.9% |
| Tendulkar (2005-12) | 259 | 36 | 24 | 254 | 39.9 | 238 | 38.7 | -1.9% | -8.1% |
Put simply, Kohli scores 17 runs more per 300 balls than Tendulkar. But Kohli's colleagues score 30 runs more per 300 balls compared to Tendulkar's colleagues. If we consider the Indian side until 2005, Kohli manages 13 runs more per 300 balls than Tendulkar did, and Kohli's colleagues score 40 runs more per 300 balls compared to Tendulkar's colleagues. Overall, scoring rates have increased by a margin of 21 runs per 300 balls (comparing targets). The difference between Kohli and Tendulkar is the support at the other end. It is this support that explains the improved results. If the two are compared as individual run chasers, then Tendulkar was actually better than Kohli is.
This idea, alongside the evidence from Dhoni's and Bevan's records, and all the others in the table above, point to an essential truth about chases in ODIs. The match-winner as a creature of habit is an illusion. As a rule, chases cannot be successfully completed from one end. Strong, successful sides have superb players (like each of the 11 in the table above), but if you want to see exceptional individual performance over a period of time, then this is far more likely to be found in a struggling team than in a successful team. In successful teams, by definition, the tasks for individual players are simpler.
Kartikeya Date writes at A Cricketing View. @cricketingview