High scores, collapses, and the lack of threes
Despite some batting collapses from the lesser teams, this could be the first World Cup with an overall run-rate of more than five runs per over
S Rajesh
11-Mar-2011
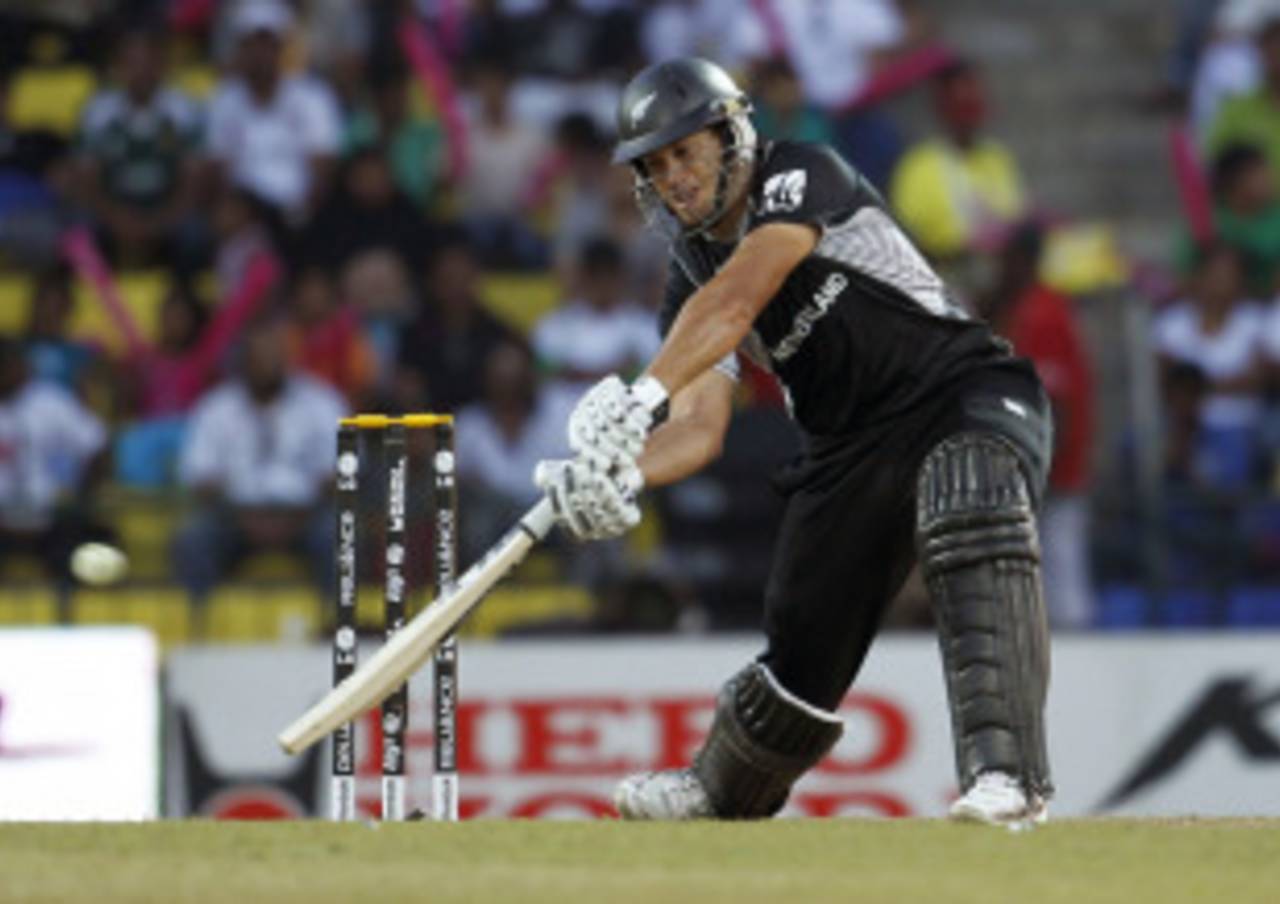
Ross Taylor has been one of several batsmen who has made good use of the batsman-friendly conditions in the subcontinent • Associated Press
The 2011 World Cup is well on its way towards becoming the most productive one for batsmen. That was always likely to be the case, considering the fact that the majority of the matches - 29 out of 47 - were to be played in India, where conditions are more batsman-friendly than in the two other countries hosting the tournament: in the two years leading up to the World Cup, the run-rate in ODIs in India was 5.87, easily superior to the rates in Sri Lanka (5.08) and Bangladesh (4.58). (Click here for the full list.)
In the World Cup so far, though, the run-rate stats are quite different - in fact, it's in reverse order, with the four games in Bangladesh having an average run-rate of 5.11, the seven in Sri Lanka managing 5.05, and the 11 in India only touching 5.03. The overall run-rate, thus, is 5.04, which is the highest among the ten World Cups so far. That's despite some abject collapses by the lesser teams over the last three weeks. In the 26 games so far, there have been two instances of teams being bowled out for less than 100, while nine times teams have finished with a score of less than 150. That, though, has been offset by the number of times teams have topped 300 - it's already happened 11 times in this World Cup, with 23 games still to come. In the 2007 edition teams topped 300 sixteen times in 51 matches, which means in the last two World Cups it's happened 27 times, which is the exactly the number of times a 300-plus score had been posted in all eight previous World Cups put together. (Click here for all 54 totals of 300 or more in World Cup matches.)
The average runs per wicket, though, hasn't changed much at all in the last four tournaments - it's been hovering around in the late 20s. The only two occasions when it exceeded 30 was when the tournaments were hosted in the subcontinent.
| Year | Matches | Average | Run-rate |
| 1975 | 15 | 29.62 | 3.91 |
| 1979 | 14 | 25.58 | 3.54 |
| 1983 | 27 | 29.52 | 4.08 |
| 1987 | 27 | 32.52 | 4.87 |
| 1992 | 39 | 29.39 | 4.42 |
| 1996 | 36 | 32.12 | 4.67 |
| 1999 | 42 | 28.41 | 4.47 |
| 2003 | 52 | 27.84 | 4.76 |
| 2007 | 51 | 29.42 | 4.95 |
| 2011 | 25 | 28.43 | 5.04 |
The group stage of this tournament, though, has been littered with one of the top sides playing one of the lesser teams. Some of those games have been unexpectedly competitive, but many have also been one-sided. Out of 26 games so far, 19 have involved at least one of Bangladesh, Zimbabwe, Ireland, Netherlands, Canada or Kenya, and in 13 of those games the margins of victory have been greater than 75 runs, or greater than five wickets with 50-plus deliveries to spare. Three matches have been decided by more than 170 runs, and three more have finished with the team batting second chasing down their target in less than 30 overs.
These 19 matches have produced uneven scores, but the high scores have compensated for the extremely low ones, such that the overall run-rate in these matches is 4.99 - not a big deviation from the tournament average of 5.04 - while the average runs per wicket in these matches is 27.69, again only a small deviation from to overall average of 28.43.
However, the contribution (or the lack of it) of the weaker teams has made a significant difference to the overall numbers of the tournament. So much, in fact, that if only the batting performances of the top eight teams are taken into account, the run-rate for the tournament so far rises to 5.66, and the average runs per wicket goes up to almost 40. Add Bangladesh and Zimbabwe to the mix, and the run-rate drops marginally to 5.44, and the average more appreciably to 34.11 (with Bangladesh's 58 all out being biggest factor for the drop). The big fall in scoring rate and averages happen when the stats for the bottom six teams is considered.
| Runs | Wickets | Average | Run rate | |
| Top eight teams (Ind, SL, RSA, Aus, Eng, Pak, NZ, WI) | 6993 | 177 | 39.50 | 5.66 |
| Top ten teams (top eight + Zim, B'desh) | 8358 | 245 | 34.11 | 5.44 |
| The bottom six (Zim, B'desh, Can, N'lands,Ken, Ire) | 3898 | 206 | 18.92 | 4.22 |
| The four Associates (Can, N'lands, Ken, Ire) | 2533 | 138 | 18.35 | 4.06 |
The manner in which teams have gone about scoring their runs in this tournament presents an interesting contrast. There are some teams which prefer to deal in boundaries; there are others who prefer less flamboyance; and then there are some who have managed to do both fairly successfully.
West Indies have scored the highest percentage of runs in boundaries - in fact they are the only ones for whom the boundary percentage exceeds 50. India come close too, which shows the firepower in the batting line-ups of those two teams. What's perhaps more surprising in the fact that India's dot-ball percentage is among the lowest too - 46.89, which means only two teams, England and Sri Lanka, have done better. That combination also explains why their run-rate is the highest of all teams in the tournament so far. Of course, their case is also helped by the fact that they've already played against the weaker teams in their group.
On the other hand, South Africa and Pakistan have extremely low boundary percentages. Pakistan's case is partly explained by the fact that they've played in Sri Lanka, where the outfields are bigger than those in India. In fact, Pakistan and Sri Lanka are the only sides which have run more than ten threes in this World Cup so far - Pakistan have 13 and Sri Lanka 12. The numbers for South Africa and England demonstrate their favoured method of scoring: England's boundary percentage is 38.16, and their dot-ball percentage is the lowest of all teams. West Indies' method is the complete opposite - rely on fours and sixes, and go easy on the singles, twos and threes. West Indies have run only one three in the tournament, which is the lowest; India have managed two.
New Zealand have been similarly sloppy in terms of dot balls - their percentage is 54.76, which is the highest among the top eight teams. They also have the second-highest number of sixes - 19, next only to India's 20 - which is largely due to Ross Taylor's incredible blitz against Pakistan, but they'll need to get better with the basics to continue their tendency to exceed expectations in World Cups.
| Team | Matches | Average | Run rate | Dot ball % | 4s/ 6s | % runs in 4s/6s |
| India | 4 | 46.20 | 6.08 | 46.89 | 107/ 20 | 49.41 |
| Sri Lanka | 5 | 46.80 | 6.03 | 46.40 | 129/ 5 | 44.86 |
| England | 4 | 37.73 | 5.82 | 44.60 | 90/ 12 | 38.16 |
| Australia | 3 | 52.11 | 5.58 | 50.40 | 40/ 4 | 39.23 |
| West Indies | 3 | 32.15 | 5.56 | 53.72 | 56/ 14 | 50.41 |
| New Zealand | 4 | 43.88 | 5.45 | 54.76 | 62/ 19 | 48.53 |
| South Africa | 3 | 41.05 | 5.25 | 48.99 | 51/ 10 | 35.72 |
| Pakistan | 4 | 28.52 | 5.25 | 53.43 | 79/ 7 | 36.91 |
| Ireland | 3 | 26.44 | 5.03 | 57.34 | 62/ 11 | 43.98 |
| Bangladesh | 3 | 18.82 | 4.62 | 55.29 | 43/ 3 | 34.80 |
| Zimbabwe | 4 | 21.00 | 4.51 | 56.47 | 67/ 5 | 36.39 |
| Netherlands | 4 | 19.88 | 4.39 | 60.22 | 65/ 9 | 43.85 |
| Canada | 4 | 16.62 | 3.47 | 70.42 | 50/ 8 | 42.61 |
| Kenya | 4 | 13.02 | 3.45 | 68.03 | 38/ 5 | 34.93 |
S Rajesh is stats editor of Cricinfo