The IPL's most and least productive overs
A look at which overs have fetched the most runs and wickets in this year's IPL, and the ones that have fetched the least
S Rajesh
04-May-2012
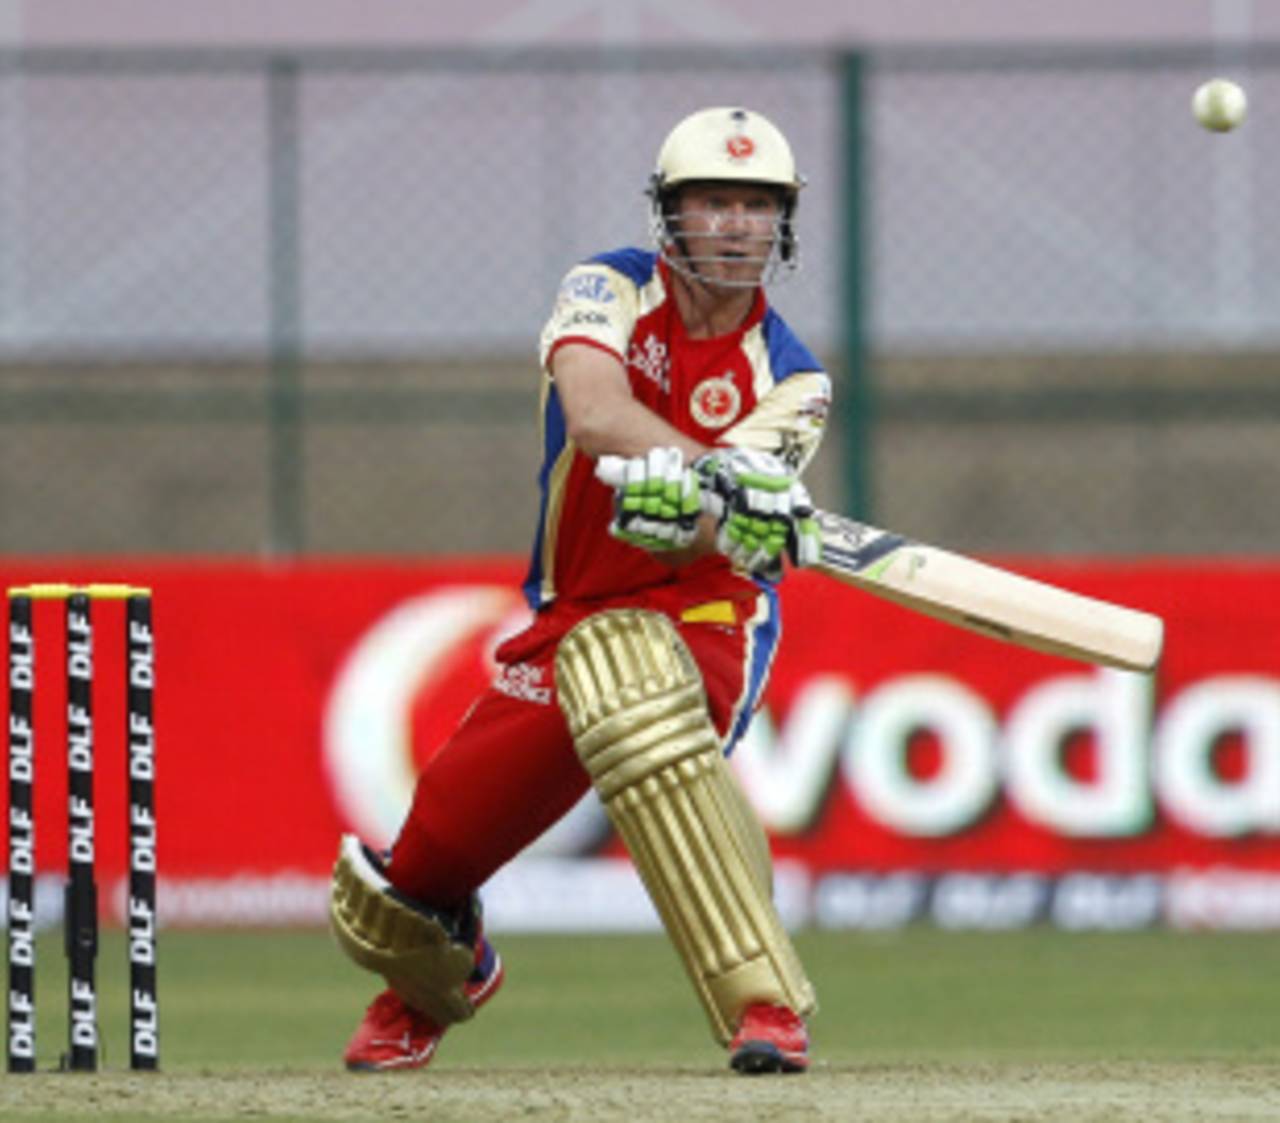
The last five overs have been the most productive in IPL 2012, followed by the last Powerplay over • Associated Press
IPL 2012 started off with bowlers having the upper hand, but gradually the batsmen have staged a comeback, so that this season's overall numbers somewhat resemble the stats of earlier IPL seasons held in India. (The 2009 edition, hosted in South Africa, has by far the lowest average and scoring rate among the five.)
However, over the first ten days, it seemed that IPL 2012 would end up being a low-scoring tournament, as batsmen struggled to mount big totals and bowlers - especially slow ones - enjoyed the lack of pace on the surfaces. In the first 15 games this season, the average runs per over was only 7.58, the average runs per wicket 20.74, and only 12 fifties were scored.
Since then, the batsmen have upped the tempo. In the next batch of 14 games, there were 20 scores of more than 50, including two hundreds, and the average and the run rate both went up significantly. And in the most recent set of 14 games, there've been 25 fifties - more than twice the number in the first 15 games - and the run rate has touched eight per over. If the rest of the tournament continues at this tempo, this edition will end up with a higher scoring rate than the previous one. The century count, though, remains comparatively low: more than halfway into the tournament, only two have been scored so far; the lowest in any IPL edition held in India is four.
| Period | Matches | Average | Run rate | 100s/ 50s |
| Till Apr 13 | 15 | 20.74 | 7.58 | 0/ 12 |
| Apr 14-22 | 14 | 28.70 | 7.87 | 2/ 18 |
| Apr 23-May 2 | 14 | 29.44 | 8.00 | 0/ 25 |
| Season | Matches | Average | Run rate | 100s/ 50s |
| 2008 | 58 | 26.03 | 8.30 | 6/ 83 |
| 2009 | 57 | 23.41 | 7.48 | 2/ 68 |
| 2010 | 60 | 26.20 | 8.12 | 4/ 88 |
| 2011 | 73 | 26.01 | 7.72 | 6/ 89 |
| 2012 | 43 | 25.58 | 7.81 | 2/ 55 |
While scoring all these quick runs, batsmen have favoured certain overs over others. The table below takes a look at the over-wise runs scored and wickets lost in IPL 2012, and also lists the run rate in each over of the previous editions.
Some of the numbers are what you'd expect them to be. For example, the run rate and the number of wickets lost is highest in the 20th over, when teams are eyeing quick runs and often have enough wickets in hand. In each season of the IPL this has been the case, though the numbers have varied: in 2008, for instance, 62 wickets went down in the 20th over and 61 in the 19th; in 2010, 76 wickets fell in the 20th and only 50 in the 19th.
For the first time, though, the last five overs - from 20th through to the 16th - have had the highest scoring rates, and exactly in that order. The 20th and the 19th are the only ones with run rates of more than ten, though the 18th is desperately close too. Here are a few other observations from the big list of numbers below:
- The first over has always been the least scoring one, but this is the first time in an IPL tournament held in India that the run rate in the first over has dipped below six an over. It happened in 2009 too, but that year South Africa had hosted the tournament. In fact, this year, the first-over run rate is dangerously close to slipping below five per over - if that does happen, it'll be the first time that the scoring rate for any over in any edition of the tournament will have dipped below five an over. Clearly, teams have taken it slow and easy at the start this year - even when the tournament was held in South Africa in 2009, the rates for the first two overs were quicker than this year.
| Over No. | 2012-wkts | Average | Run rate | 2011 RR | 2010 RR | 2009 RR | 2008 RR |
| 20 | 52 | 12.80 | 10.32 | 10.21 | 10.91 | 9.89 | 11.13 |
| 19 | 43 | 17.25 | 10.18 | 9.86 | 10.04 | 9.00 | 10.51 |
| 18 | 41 | 18.24 | 9.99 | 9.06 | 9.46 | 9.59 | 10.00 |
| 17 | 34 | 20.38 | 8.96 | 8.23 | 9.50 | 9.15 | 9.79 |
| 16 | 23 | 30.52 | 8.84 | 8.52 | 8.36 | 8.17 | 8.72 |
| 6 | 24 | 30.33 | 8.66 | 7.85 | 7.88 | 7.98 | 8.45 |
| 4 | 21 | 32.71 | 8.17 | 7.22 | 8.46 | 7.72 | 7.86 |
| 12 | 29 | 23.13 | 8.06 | 7.66 | 7.43 | 7.31 | 8.49 |
| 14 | 20 | 32.70 | 8.04 | 7.48 | 8.17 | 7.46 | 8.70 |
| 15 | 26 | 24.19 | 7.78 | 8.62 | 7.67 | 7.94 | 8.96 |
| 3 | 18 | 36.11 | 7.73 | 7.80 | 7.92 | 7.20 | 7.12 |
| 5 | 12 | 52.75 | 7.53 | 7.22 | 8.53 | 8.14 | 8.76 |
| 13 | 26 | 23.73 | 7.52 | 7.65 | 8.09 | 7.22 | 7.90 |
| 11 | 19 | 32.52 | 7.35 | 7.40 | 7.43 | 6.49 | 8.25 |
| 8 | 18 | 33.50 | 7.17 | 7.64 | 7.04 | 6.65 | 7.41 |
| 9 | 19 | 31.57 | 7.14 | 7.50 | 7.49 | 6.88 | 7.46 |
| 10 | 19 | 29.78 | 6.73 | 7.06 | 7.45 | 6.09 | 7.57 |
| 2 | 20 | 26.45 | 6.29 | 6.74 | 8.15 | 6.73 | 7.95 |
| 7 | 16 | 31.37 | 5.97 | 6.03 | 7.27 | 5.66 | 7.20 |
| 1 | 15 | 28.40 | 5.07 | 6.35 | 6.38 | 5.56 | 6.06 |
S Rajesh is stats editor of ESPNcricinfo. Follow him on Twitter