The leader of the pack
Peter Siddle has taken over as Australia's premier fast bowler in the last 20 months, taking plenty of wickets and often dismissing the key opposition batsmen
S Rajesh
Jul 12, 2013, 3:04 AM
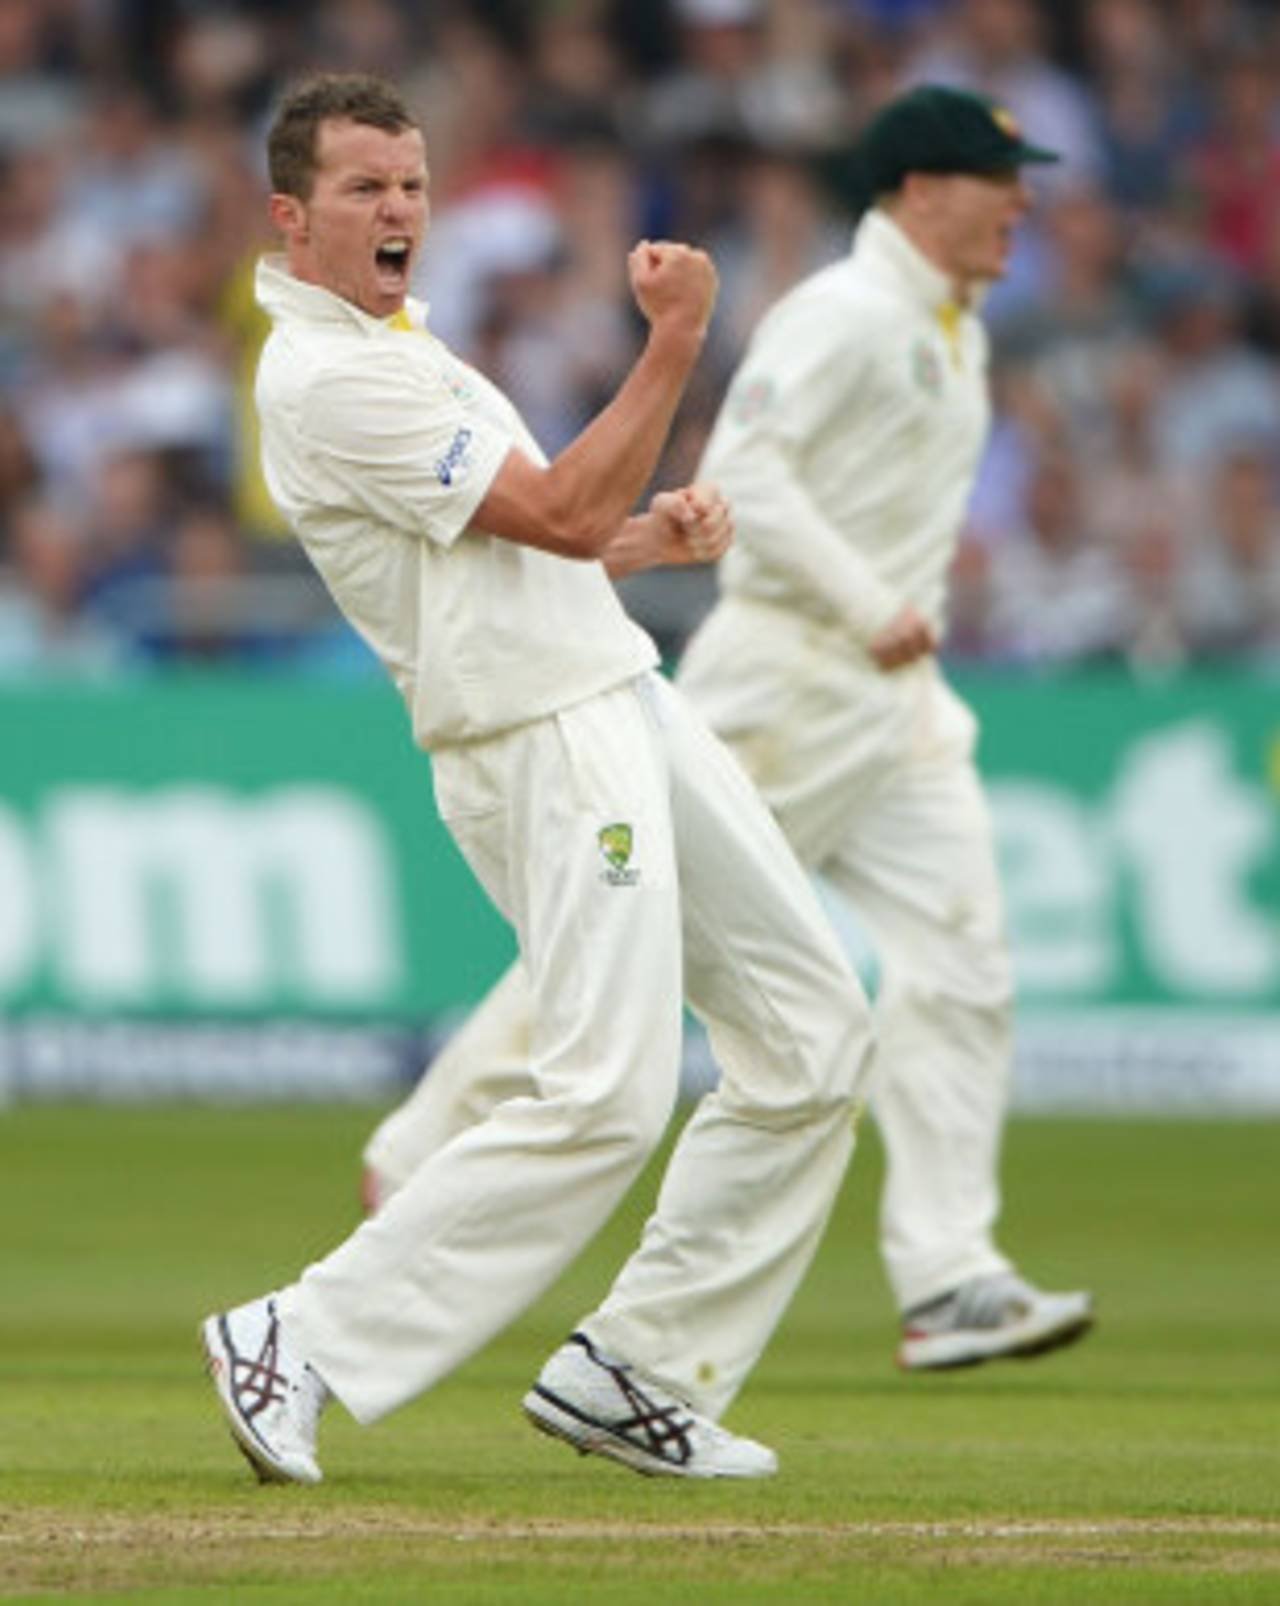
In his last 17 Tests, Peter Siddle averages 23.34 runs per wicket, which is a big improvement on his average of 32.58 in his first 25 Tests • Getty Images
The last couple of years has been a period of considerable flux for the Australian team: senior players have retired, the replacements haven't always been good enough, and there've been several off-field issues for the management to contend with. The batting has largely been in a shambles, but amid all the confusion, one fast bowler has risen above the ranks and taken over the mantle of leadership of Australia's bowling attack in the last 20 months.
Once seen as one of several promising fast bowlers in the land, Peter Siddle is now the top man in the Australian attack, and Michael Clarke's go-to bowler when things get rough. That was most recently in evidence in England's first innings at Trent Bridge, when Siddle, after an ineffective first spell, rocked England's middle order, as they slid from a comfortable 78 for 1 to 180 for 6 - and eventually to 215 all out. Siddle finished with 5 for 50, and each of his victims was an accomplished batsman - Joe Root, Jonathan Trott, Kevin Pietersen, Ian Bell and Matt Prior were his five victims.
Having spent almost five years in the Australian Test side, it appears Siddle has understood the demands of the five-day game. He doesn't move the ball around as prodigiously as some of the other fast bowlers around, but his consistency and relentless intensity are qualities which have served him and Australia well.
In the first three years of his Test career, Siddle had a mixed record, with some top-notch performances interspersed with some ordinary ones. Among his good moments were the home and away Test series against South Africa in 2008-09, when he took 25 wickets in six Tests, and the 2009 Ashes, when he took 20 wickets at 30.80. However, there were also the less spectacular moments, like the tour to South Africa in 2011, when he took only four wickets in two Tests at 51.25 in a low-scoring series. Then there was also the home Ashes series in 2010-11, when he took 6 for 54 in the first innings at the Gabba, and then managed only eight more wickets in the next four Tests. (Click here for his series-wise stats.)
Since the home season of 2011-12, though, Siddle has been far more consistent. Most of his best displays have still come in home conditions, but he took a five-for in Mohali, on the tour to India earlier this year. Overall, in the last 20 months he has taken 73 wickets from 17 Tests at an average of 23.34, which is much more impressive than the stats in his first 25 Tests: 82 wickets at 32.58.
| Period | Wickets | Average | Strike rate | Econ rate | 5WI/ 10WM |
| First 25 Tests | 82 | 32.58 | 63.4 | 3.07 | 4/ 0 |
| Last 17 Tests | 73 | 23.34 | 48.3 | 2.89 | 4/ 0 |
| Career | 155 | 28.23 | 56.3 | 3.00 | 8/ 0 |
In this 20-month period, Siddle's average and strike rate are among the best. Only Vernon Philander and Dale Steyn have better averages and strike rates, while Sri Lanka's Rangana Herath has a slightly better average as well. Siddle has an outstanding strike rate during this period, but unlike most of the bowlers on the list below, he doesn't have a ten-wicket haul in Tests: his best remains 9 for 104 against Sri Lanka in Hobart in December last year. In most other aspects, though, he is up there with the best.
| Bowler | Tests | Wickets | Average | Strike rate | 5WI/ 10WM |
| Vernon Philander | 14 | 75 | 17.73 | 38.6 | 7/ 2 |
| Dale Steyn | 17 | 83 | 21.16 | 45.2 | 5/ 1 |
| Rangana Herath | 15 | 90 | 22.90 | 52.6 | 10/ 3 |
| Peter Siddle | 17 | 73 | 23.34 | 48.3 | 4/ 0 |
| Saeed Ajmal | 11 | 59 | 23.72 | 53.1 | 3/ 2 |
| Graeme Swann | 17 | 69 | 27.95 | 59.6 | 4/ 2 |
| James Anderson | 20 | 69 | 28.15 | 65.0 | 2/ 0 |
| Stuart Broad | 17 | 63 | 28.69 | 55.4 | 4/ 1 |
The table below shows Siddle clearly prefers bowling to right-handers: he averages 27.36 against them, and about seven runs more against left-handers. However, in the last 20 months he has improved his stats against them too, averaging 26.70 versus the left-handers (and 22.37 against right-handers).
| Wickets | Average | Econ rate | |
| Right-hand batsmen | 120 | 27.36 | 2.89 |
| Left-hand batsmen | 35 | 34.37 | 2.87 |
Not surprisingly, the batsmen that Siddle's had the most success against are mostly right-handers. AB de Villiers and Prior have been dismissed by him six times, with Prior having a particularly poor average. Pietersen has struggled against him too, falling five times at an average of 17.60. Those are numbers that both Pietersen and Prior will try to redress over the next couple of months. Three of India's top-order batsmen have fallen to him four times, with Virat Kohli and Virender Sehwag averaging in the 20s.
The only left-hander in the list below is Cook, who has fallen four times to Siddle at an average of 35.75. Siddle's also maintained good economy rates against most of these batsmen, which shows he has bowled economically and sustained the pressure: Amla, Kohli and Cook have all scored at less than 2.5 an over against him. Prior and Sehwag have scored more quickly, but haven't succeeded at doing it for long periods.
Siddle also has superb stats against Kumar Sangakkara (three wickets for 27 runs in 86 balls) and Gautam Gambhir (three wickets for 71 in 120), but a couple of others have haven't had so many problems against him: Graeme Smith and Andrew Strauss have fallen to him twice, but have scored 152 and 158 runs off him.
| Batsman | Runs | Balls | Dismissals | Average | Runs per over |
| AB de Villiers | 194 | 434 | 6 | 32.33 | 2.68 |
| Matt Prior | 109 | 150 | 6 | 18.16 | 4.36 |
| Kevin Pietersen | 88 | 171 | 5 | 17.60 | 3.08 |
| Hashim Amla | 173 | 465 | 4 | 43.25 | 2.23 |
| Alastair Cook | 143 | 345 | 4 | 35.75 | 2.48 |
| Virat Kohli | 98 | 249 | 4 | 24.50 | 2.36 |
| Virender Sehwag | 104 | 132 | 4 | 26.00 | 4.72 |
| Sachin Tendulkar | 141 | 216 | 4 | 35.25 | 3.91 |
So far, after 42 Tests, Siddle's numbers stack up reasonably well with other Australian leading fast bowlers in the last 40 years. His average and strike rate are almost identical with those of Craig McDermott, who finished with 291 wickets from 71 Tests, and finished with an average of 28.63, which was about the same as his average after 42. Given that Siddle's on the way up in his Test career, he'll want his career average to look better than it is now when he finally finishes with Test cricket.
| Bowler | Wickets | Average | Strike rate | 5WI/ 10WM |
| Glenn McGrath | 188 | 23.63 | 53.8 | 11/ 0 |
| Dennis Lillee | 214 | 24.15 | 52.5 | 15/ 5 |
| Jason Gillespie | 162 | 24.98 | 51.6 | 7/ 0 |
| Craig McDermott | 178 | 28.37 | 55.1 | 9/ 2 |
| Brett Lee | 159 | 32.85 | 53.6 | 4/ 0 |
S Rajesh is stats editor of ESPNcricinfo. Follow him on Twitter