A limited-overs champion
Shane Watson's Test career was underwhelming, but with his brute batting force and his canny bowling, he was an absolute asset in the limited-overs formats
S Rajesh
25-Mar-2016
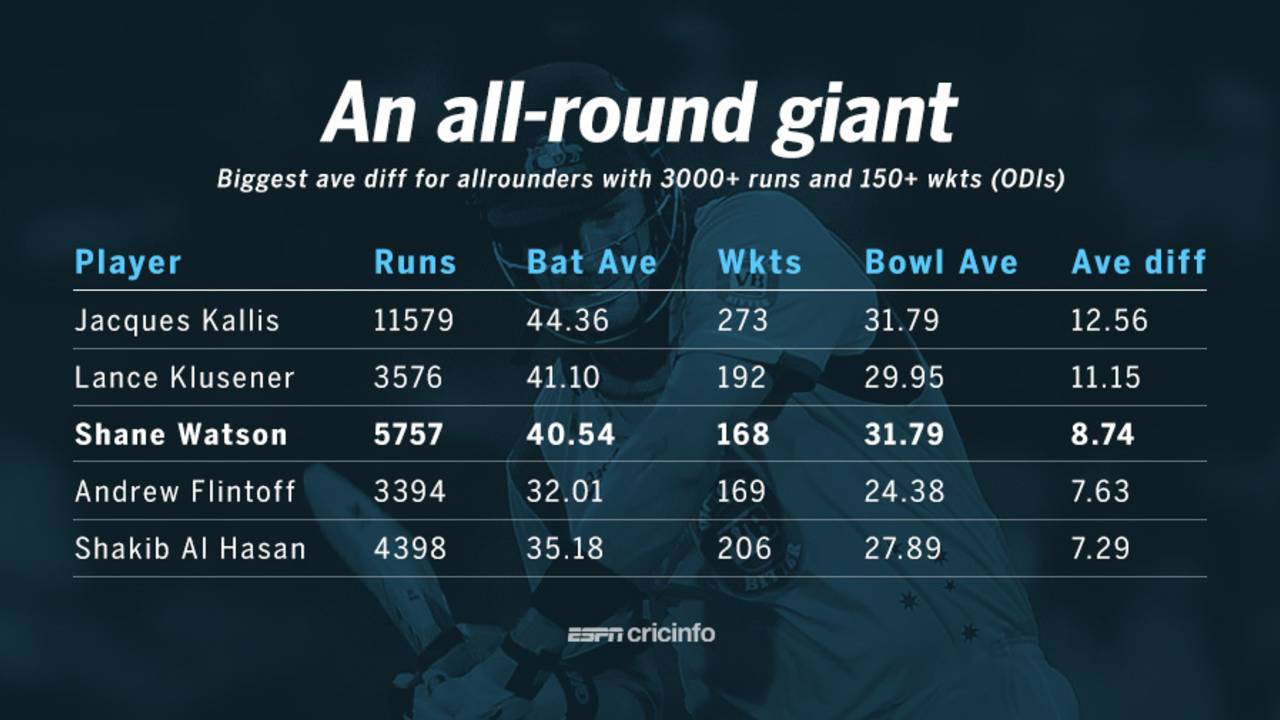
Among players with 3000-plus runs and 150-plus wickets in ODIs, only two players have a bigger difference between batting and bowling averages • ESPNcricinfo Ltd
Shane Watson's body of work over a 14-year career in international cricket is impressive: 3731 runs and 75 wickets in Tests, 5757 runs and 168 wickets in ODIs, and 1400 runs and 46 wickets in T20Is. (The last set of numbers will increase as Australia have at least two more matches left in the World T20.) Add up those three sets of numbers, and you get a healthy sum of 10,888 runs and 289 wickets, which makes him one of only seven players to achieve the double of 10,000 runs and 250 wickets in international cricket; the only other Australian to achieve this is Steve Waugh.
There remains a persistent feeling that he underachieved in Tests, but in the limited-overs format his numbers are superb, with both bat and ball. In ODIs, he finishes with a batting average of 40.54 at a strike rate of 90.44, including nine centuries; with the ball, his 168 wickets came at 31.79 each, at an economy rate of 4.95. Despite being so injury prone, he is among a select band of 11 allrounders to score more than 5000 runs and bowl more than 1000 overs in ODIs.
Watson's best years in ODIs were between 2007 and 2011. In those five years, he scored 60% of his career runs, and took 51% of his career wickets in that format. His batting average during that period soared to 47.28 at a strike rate of more than 94, while his bowling average dropped to 28.50. Of the 17 Man-of-the-Match awards he won in his ODI career, 11 came during that five-year period between 2007 and 2011. (Overall, only five Australians won more MoM awards in ODIs than Watson.)
| Period | Matches | Runs | Ave | SR | Wkts | Ave | ER |
| Till Dec 2006 | 52 | 734 | 30.58 | 72.81 | 52 | 31.28 | 4.67 |
| 2007 to 2011 | 88 | 3452 | 47.28 | 94.54 | 86 | 28.50 | 4.98 |
| Jan 2012 onwards | 50 | 1571 | 34.91 | 92.08 | 30 | 42.13 | 5.30 |
| Career | 190 | 5757 | 40.54 | 90.44 | 168 | 31.79 | 4.95 |
Watson was more than handy as a bowler, but the numbers he put up with the bat alone are worthy of a top-class batsman. He is one of only three batsmen to score 5000-plus ODI runs at a 40-plus average and a 90-plus strike rate; AB de Villiers and Viv Richards are the others in this exclusive club, which makes this an extremely special achievement. Admittedly, there are three batsmen who have strike rates between 89 and 90 and miss this club by a whisker - Virat Kohli, MS Dhoni and Hashim Amla - but even so, Watson has the bragging rights of being in the company of two batsmen who are easily among the all-time greats of ODI batting.
| Player | Inns | Runs | Ave | SR | 100s |
| AB de Villiers | 192 | 8621 | 54.56 | 100.18 | 24 |
| Viv Richards | 167 | 6721 | 47.00 | 90.20 | 11 |
| Shane Watson | 169 | 5757 | 40.54 | 90.44 | 9 |
Also, his powerful front-foot technique was particularly effective in Asia, where he had an incredible average of 48.27 at a strike rate of 94.34. He averaged almost 43 in India, 90 in the UAE, and 147 in Bangladesh, where he made his highest ODI score of 185 not out. The only Asian country where he didn't have as much success was in Sri Lanka, where his average dropped to 31.42 in eight innings. Among non-Asian batsmen who have played at least 30 ODI innings in Asia, Watson's average is fifth highest, while his strike rate is fourth among these 73 batsmen, after Richards, de Villiers and Adam Gilchrist.
| Player | Inns | Runs | Average | Strike rate | 100s |
| Gary Kirsten | 45 | 2265 | 59.60 | 77.75 | 5 |
| AB de Villiers | 46 | 2193 | 57.71 | 99.00 | 10 |
| Michael Clarke | 47 | 1904 | 54.40 | 76.74 | 4 |
| Michael Bevan | 59 | 2101 | 52.52 | 76.56 | 1 |
| Shane Watson | 42 | 1786 | 48.27 | 94.34 | 3 |
| Hansie Cronje | 45 | 1785 | 48.24 | 79.75 | 1 |
| David Boon | 39 | 1615 | 46.14 | 69.91 | 1 |
| Kevin Pietersen | 40 | 1638 | 45.50 | 87.17 | 3 |
| Viv Richards | 43 | 1669 | 45.10 | 103.92 | 3 |
| Andrew Symonds | 36 | 1210 | 44.81 | 87.49 | 2 |
During his five best years - 2007 to 2011 - Watson's batting numbers in ODIs compared favourably with the best. He averaged 47.28 at a strike rate of almost 95, while Sachin Tendulkar averaged 50.33 at a strike rate of 90, AB de Villiers 51.83 at 94.15, and Hashim Amla had an average of 55.17 at 91.98. Add his bowling numbers during this period - 86 wickets at 28.50 - and he becomes arguably the most valuable ODI player in these five years.
Watson won 11 Man-of-the-Match awards during this period; only MS Dhoni, Shahid Afridi, with 12 awards each, won more. However, all of them played more games than Watson's 88: Dhoni played 137, Yuvraj 115, and Afridi 99. In these five years, the difference between Watson's batting and bowling averages - which is a good indicator of all-round prowess - was 18.78. Among the nine allrounders who scored 1500-plus runs and took 40 wickets in ODIs during this period, that difference between batting and bowling averages for Watson was the best. Only Jacques Kallis came close, with a difference of 17.83, while for all the others the difference was below five.
| Player | Mat | Runs | Bat Av | SR | Wkts | Bowl Av | ER | Ave Diff |
| Shane Watson | 88 | 3452 | 47.28 | 94.54 | 86 | 28.50 | 4.98 | 18.78 |
| Jacques Kallis | 75 | 3045 | 51.61 | 80.76 | 49 | 33.77 | 4.89 | 17.83 |
| Yuvraj Singh | 115 | 3765 | 41.37 | 89.72 | 68 | 36.57 | 5.11 | 4.80 |
| Shakib Al Hasan | 108 | 3037 | 33.74 | 77.73 | 139 | 29.09 | 4.38 | 4.65 |
| Mohammad Hafeez | 48 | 1521 | 33.80 | 75.48 | 46 | 29.36 | 4.00 | 4.43 |
| Kevin O'Brien | 62 | 1601 | 33.35 | 80.98 | 48 | 30.08 | 4.90 | 3.27 |
| Paul Collingwood | 94 | 2781 | 38.09 | 79.84 | 61 | 38.93 | 4.91 | -0.83 |
| Shahid Afridi | 99 | 2013 | 25.80 | 133.84 | 140 | 28.95 | 4.55 | -3.14 |
| Elton Chigumbura | 90 | 1840 | 24.21 | 87.99 | 75 | 36.66 | 5.68 | -12.45 |
On that parameter, even his overall numbers are impressive: the difference of 8.74 is third highest, among the 19 allrounders who have scored 3000 runs and taken 150 wickets in ODIs. Only Kallis and Lance Klusener have a higher difference.
| Player | Mat | Runs | Bat Av | SR | Wkts | Bowl Av | ER | Ave diff |
| Jacques Kallis | 328 | 11579 | 44.36 | 72.89 | 273 | 31.79 | 4.84 | 12.56 |
| Lance Klusener | 171 | 3576 | 41.10 | 89.91 | 192 | 29.95 | 4.70 | 11.15 |
| Shane Watson | 190 | 5757 | 40.54 | 90.44 | 168 | 31.79 | 4.95 | 8.74 |
| Andrew Flintoff | 141 | 3394 | 32.01 | 88.82 | 169 | 24.38 | 4.39 | 7.63 |
| Shakib Al Hasan | 157 | 4398 | 35.18 | 80.31 | 206 | 27.89 | 4.30 | 7.29 |
| Imran Khan | 175 | 3709 | 33.41 | 72.65 | 182 | 26.61 | 3.89 | 6.79 |
| Chris Gayle | 269 | 9221 | 37.33 | 85.11 | 163 | 35.20 | 4.76 | 2.12 |
| Shaun Pollock | 303 | 3519 | 26.45 | 86.69 | 393 | 24.50 | 3.67 | 1.95 |
| Sachin Tendulkar | 463 | 18426 | 44.83 | 86.23 | 154 | 44.48 | 5.10 | 0.35 |
| Carl Hooper | 227 | 5761 | 35.34 | 76.63 | 193 | 36.05 | 4.36 | -0.70 |
| Steve Waugh | 325 | 7569 | 32.90 | 75.91 | 195 | 34.67 | 4.56 | -1.76 |
And then there are his numbers in T20Is, a format he took to with gusto. With a few more games to go in the World T20, Watson's current T20I strike rate is 144.47. Among the 47 batsmen who have scored at least 750 runs in this format, Watson's strike rate is fourth best, after those of Aaron Finch, Shahid Afridi and Chris Gayle. He is one of only two Australians to score centuries in this format, while his 80 sixes is third highest, next only to Gayle (98) and Brendon McCullum (91).
And with the ball, he has made vital contributions, taking 46 wickets at 24.71 and an acceptable economy rate of 7.63. Hopefully, over the next week or two, he will get the opportunity to take at least four more wickets at get up to 50, another landmark that will be richly deserved in a long and successful limited-overs career.
| Player | Inns | Runs | Ave | SR | 50+ scores |
| Aaron Finch | 26 | 916 | 39.82 | 152.92 | 7 |
| Shahid Afridi | 89 | 1391 | 18.06 | 150.37 | 4 |
| Chris Gayle | 44 | 1506 | 37.65 | 145.64 | 15 |
| Shane Watson | 54 | 1400 | 28.00 | 144.47 | 11 |
| Kevin Pietersen | 36 | 1176 | 37.93 | 141.51 | 7 |
| David Warner | 59 | 1618 | 28.89 | 140.32 | 12 |
S Rajesh is stats editor of ESPNcricinfo. Follow him on Twitter