Measuring Team Stability
Analysing the stability of the Australian ODI team since 1979
Ric Finlay
25-Feb-2013
Ric Finlay
Australia's hectic ODI programme this year, involving 32 different players playing in 39 matches, set me wondering if there had ever been a higher "churn" of players for the team. It was easy to establish that the 39 matches was a record high for Australia in a calendar year, beating the 37 matches played in 1999, and never before had Australia fielded as many as 32 players in the same time span; the previous highest was 26 in 1997.
But the high number of matches played creates an expectation of a high number of players; it well may be that the team was more stable in 2009 than in 2008, when only 18 matches were played, but as many as 20 different players were used.
Attempting to quantify team stability from these statistics is not as straightforward as it may initially seem. One could perform a division and come up with 0.82 players per match for 2009, against 1.11 for 2008 but this is meaningless for those who understand that each team contains 11 players!
Even multiplying the number of matches by 11, and dividing by the number of players (13.4 for 2009, 9.9 for 2008), giving an average number of matches per player in the calendar year, is not really useful since it doesn't allow comparison between different years when different numbers of matches were played.
In the end, I decided to start with the premise that each calendar year commences with a match in which eleven players take part, and to then measure the changes that occurred subsequent to that first match.
So, for 2009, after the first match, we had another 21 players representing Australia in the next 38 matches, giving a stability index of 0.55 extra players per match. In 2008, it was another nine players in 17 matches, for an index of 0.53.
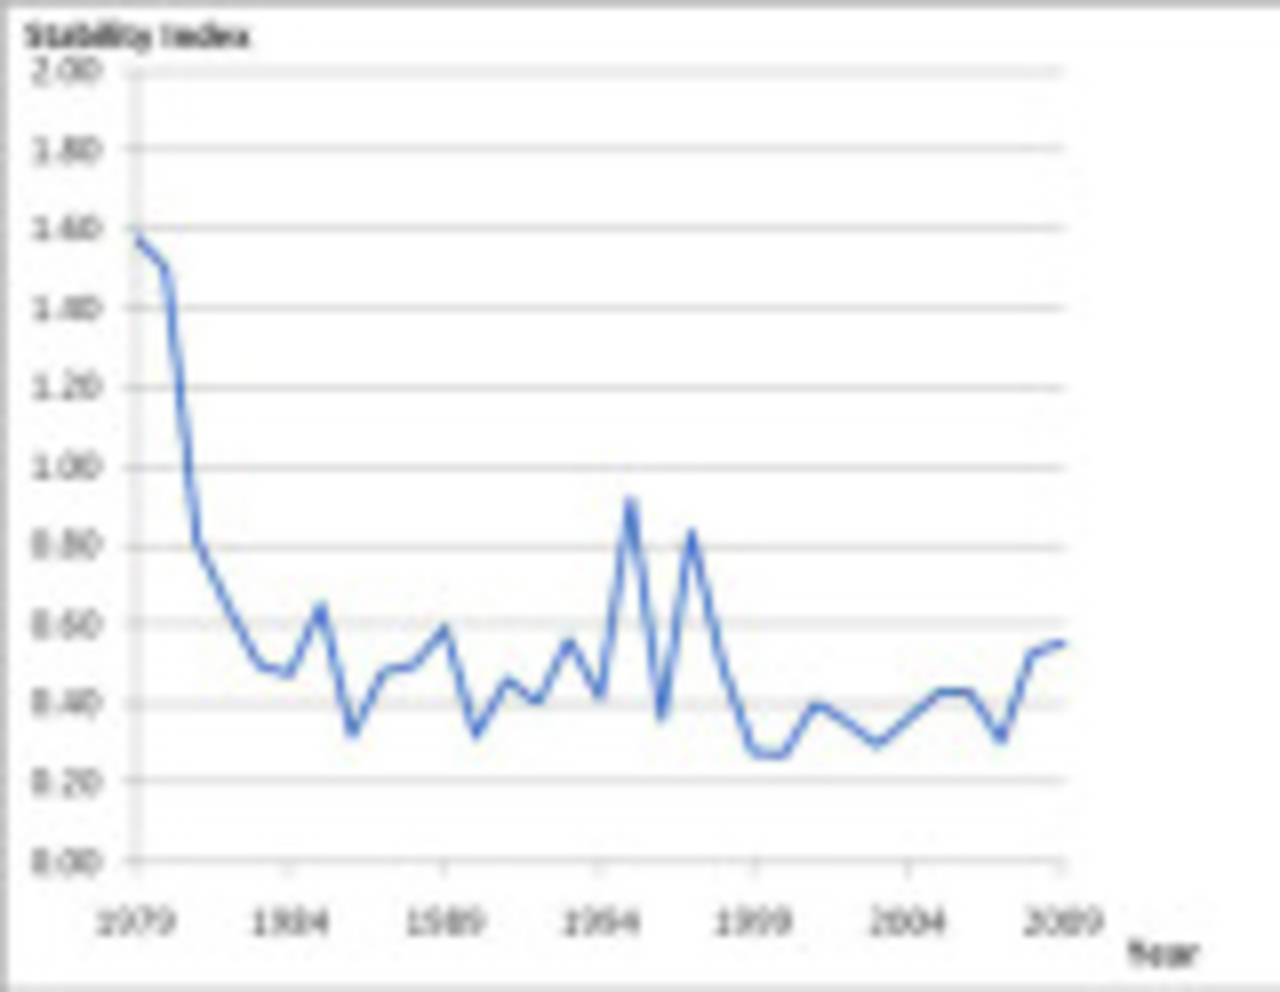
Doing this for Australian teams in each calendar year since 1979, when ODIs became an integral part of the cricket scene, gives the following results:
| Year | Matches | Players | Stability Index |
| 1979 | 13 | 30 | 1.58 |
| 1980 | 9 | 23 | 1.50 |
| 1981 | 17 | 24 | 0.81 |
| 1982 | 15 | 20 | 0.64 |
| 1983 | 23 | 22 | 0.50 |
| 1984 | 22 | 21 | 0.48 |
| 1985 | 21 | 24 | 0.65 |
| 1986 | 23 | 18 | 0.32 |
| 1987 | 24 | 22 | 0.48 |
| 1988 | 15 | 18 | 0.50 |
| 1989 | 18 | 21 | 0.59 |
| 1990 | 23 | 18 | 0.32 |
| 1991 | 14 | 17 | 0.46 |
| 1992 | 21 | 19 | 0.40 |
| 1993 | 17 | 20 | 0.56 |
| 1994 | 30 | 23 | 0.41 |
| 1995 | 13 | 22 | 0.92 |
| 1996 | 26 | 20 | 0.36 |
| 1997 | 19 | 26 | 0.83 |
| 1998 | 25 | 23 | 0.50 |
| 1999 | 37 | 21 | 0.28 |
| 2000 | 23 | 17 | 0.27 |
| 2001 | 21 | 19 | 0.40 |
| 2002 | 29 | 21 | 0.36 |
| 2003 | 35 | 21 | 0.29 |
| 2004 | 26 | 20 | 0.36 |
| 2005 | 29 | 23 | 0.43 |
| 2006 | 29 | 23 | 0.43 |
| 2007 | 34 | 21 | 0.30 |
| 2008 | 18 | 20 | 0.53 |
| 2009 | 39 | 32 | 0.55 |
The table indicates that the Australian team has been less stable over the past couple of years than in the previous nine years, an era of great success for the team. There are significant spikes in the years preceding World Cups (eg, 1995, 1997-98), presumably as selectors experimented with players in an effort to strike the right combination, while the World Cup years themselves seem to be more stable.
The two years just after the cessation of Kerry Packer's World Series can be seen as being the most tumultuous in terms of team selection, with an average of over 1.5 new players per match. After that, the benefits of having a stable team became to be recognised, and the ratios dropped quickly, although not initially to the levels reached in the 2000s, Australia's ODI golden age.
There is much more that can be investigated here, including looking at other teams, and correlating team stability with team success.